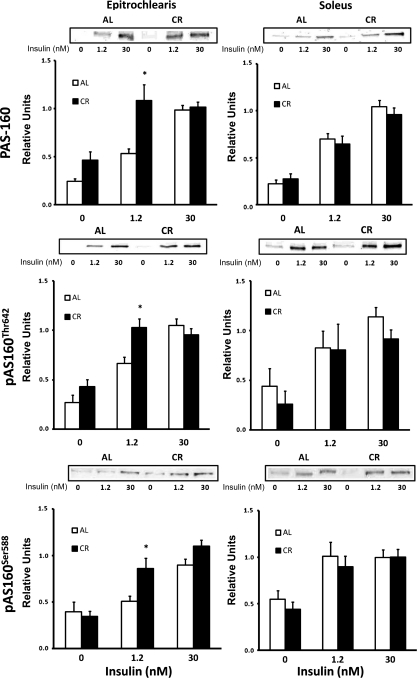
Fig. 11.
Top: immunoreactivity of the 160-kDa band after immunoblotting with phospho-Akt substrate (PAS) antibody in epitrochlearis and soleus muscles with 0, 1.2, or 30 nM insulin. Middle: pAS160Thr642 in epitrochlearis and soleus muscles with 0, 1.2, or 30 nM insulin. Bottom: pAS160Ser588 in epitrochlearis and soleus muscles with 0, 1.2, or 30 nM insulin. *P < 0.05, CR vs. AL in the same insulin treatment group. ANOVA P values are as follows: for epitrochlearis PAS-160, P < 0.001 (diet), P < 0.001 (insulin), and P = 0.011 (interaction); for pAS160Thr642, P = 0.02 (diet), P < 0.001 (insulin), and P = 0.01 (interaction); for pAS160Ser588, P = 0.013 (diet), P < 0.001 (insulin), and P = 0.046 (interaction); for soleus PAS-160, P = 0.624 (diet), P < 0.001 (insulin), and P = 0.559 (interaction); for pAS160Thr642, P = 0.303 (diet), P < 0.001 (insulin), and P = 0.813 (interaction); for pAS160Ser588, P = 0.4 (diet), P < 0.001 (insulin), and P = 0.816 (interaction). Values are means ± SE; n = 7–14 muscles per dietary group and insulin concentration.

