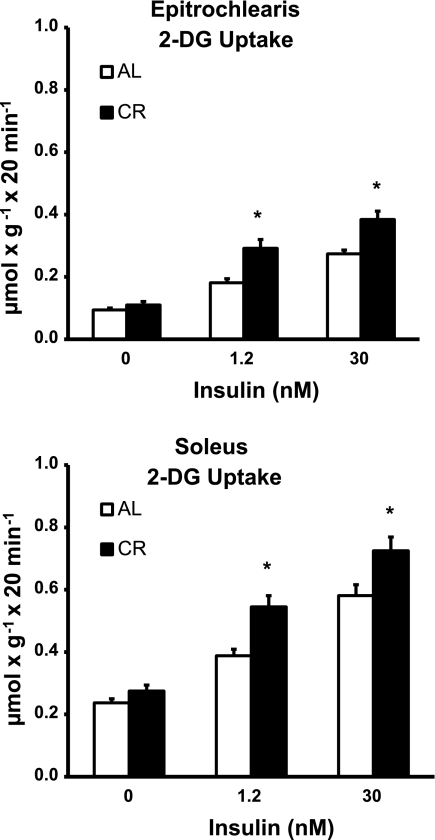
Fig. 2.
2-Deoxy-d-glucose (2-DG) uptake in epitrochlearis and soleus muscles with 0, 1.2, or 30 nM insulin. *P < 0.05, CR vs. AL in the same insulin treatment group. ANOVA P values are as follows: for epitrochlearis, P < 0.001 (diet), P < 0.001 (insulin), and P = 0.012 (interaction); for soleus, P < 0.001 (diet), P < 0.001 (insulin), and P = 0.096 (interaction). Values are means ± SE; n = 16–18 muscles per diet group and insulin concentration.

