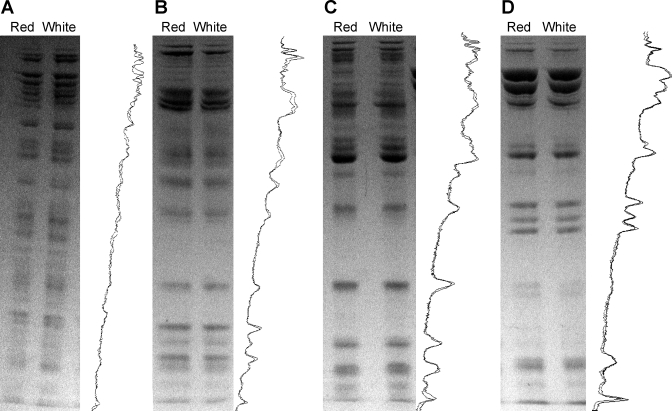
Fig. 4.
Composition of oxidative phosphorylation components using 2D BN-PAGE. Individual bands corresponding to electron transport chain (ETC) Complexes I (A), III (B), IV (C), and V (D) were cut from gel lanes as shown in Fig. 2 and separated by molecular weight using an SDS buffer. Whole gel lane density traces for both mitochondrial types are shown to the right of each gel.

