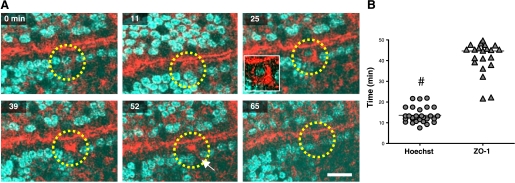
Fig. 2.
En profile imaging of cell shedding and ZO-1 redistribution in vivo. A: time-course imaging of epithelial villus cell that undergoes extrusion (yellow circle), visualizing mRFP1-ZO-1 (red) and Hoechst 33342 (blue) recorded in en profile view. Apical redistribution of ZO-1 is seen at 11 min, with funnel-shape formation of ZO-1 migrating to the basal pole and engulfing the upward moving cell nucleus at 25 min. Eventually, the epithelial cell is extruded into the lumen, leaving a “gap” behind (white arrow) while remaining ZO-1 appears condensed at the site of shedding (39–65 min). Scale bar = 10 μm. B: cell shedding time span measured with Hoechst 33342 (between initiation of cell nucleus migration and extrusion) and ZO-1 (between initial accumulation in the apical cytoplasm and the final apical retention after extrusion). Values are means ± SE; #P < 0.001; n = 28 time courses in 18 mice.

