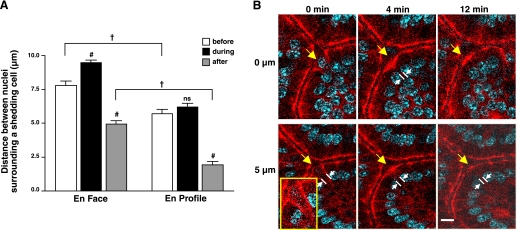
Fig. 5.
Comparison of en face and en profile measures of the space (gap) in the epithelial layer resulting from cell shedding. Cell nuclei were stained with Hoechst 33342. A: measurements made of the distance between the epithelial cell nuclei that are on either side flanking a shedding cell before, during, and after cell extrusion. In en face views, measured as linear distance between nuclei averaging values from three lines each crossing the center of the shedding cell to intersect a pair of nuclei in different flanking cells. In en profile view, measured as linear distance between the two nuclei flanking the shedding cell (as highlighted in B). Comparisons to the “before” condition in the same viewing orientation: ns, not significant. #P < 0.001, comparisons between viewing orientation in same time category; †P < 0.001. (n = 45 in total). B: yellow arrow identifies shedding cell in en profile view, and white lines and arrows demark distance between flanking nuclei surrounding the shedding cell. Inset: highlight of ZO-1 funnel.

