Fig. 2.
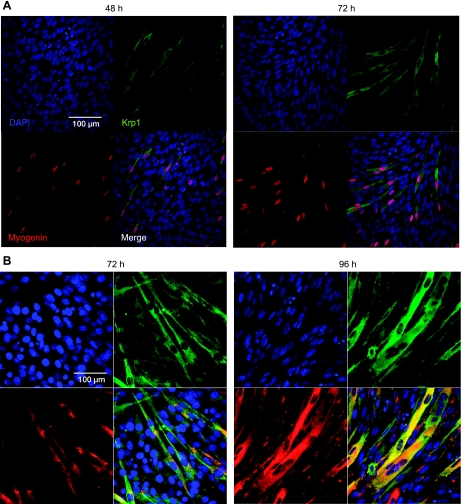
Immunofluorescence to reveal Krp1 localization in differentiating C2 cells. C2 cells were cultured in DM for the time points indicated, and immunofluorescence was performed to display DAPI (blue), Krp1 (green), and myogenin (red) in A or DAPI (blue), Krp1 (green), and MHC (red) in B. Merged images are also displayed; representative images from 3 independent experiments.

