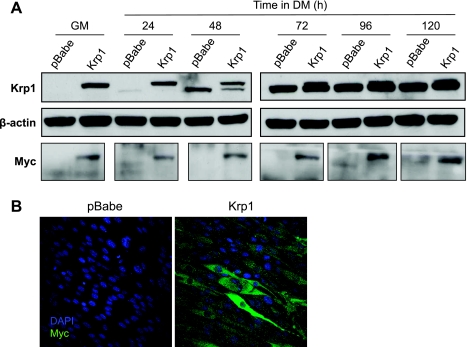
Fig. 6.
Stable overexpression of Krp1-myc in C2 cells. A, top: Krp1 protein levels in C2 cells stably expressing vector alone (pBabe) or Krp1-myc (Krp1) in GM and in DM for the times indicated. Endogenous Krp1 is the bottom band, and Krp1-myc is the top band. A, middle: β-actin (loading control). A, bottom: myc to display the transfected Krp1. B: immunofluorescence to show the localization of transfected Krp1-myc by myc IF. Representative of n = 3 separate experiments.

