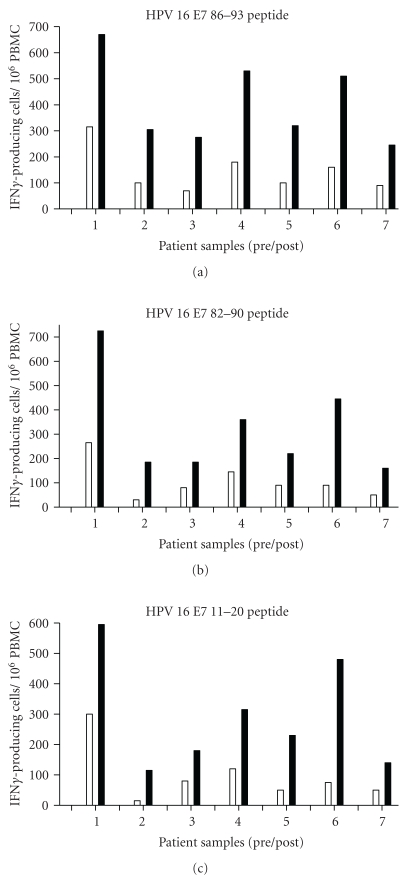
Figure 3.
Immune response before and after vaccination. Note: ELISPOT data as number of spots per 106 input CD8 cells is shown on the ordinate, with paired patient samples (prevaccine, white columns; postvaccine, black columns) indicated on the abscissa. Each panel is shown for the individual peptide indicated at the top. In each case, the maximum response postvaccination is shown.

