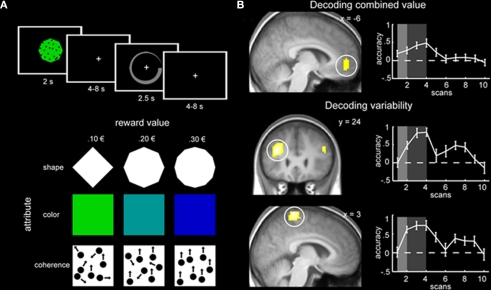
Figure 3.
(A) Experimental design of the multi-attribute decision making task. Each stimulus consisted of three dimensions and participants had to make a decision about the stimulus value by indicating value on a circular rating scale (top panel). The three dimensions were shape, color, and coherence of moving dots; each dimension had three levels with different values (bottom panel). (B) Regions with significant prediction accuracy in the VMPFC for stimulus value (top panel) and the DLPFC and DMPC for stimulus variability (bottom two panels). Graphs on the right plot prediction accuracy across the trial. Figure taken from Kahnt et al. (2011).

