Abstract
Background
MRI allows visualization of location and extent of RF ablation lesion, myocardial scar formation, and real-time (RT) assessment of lesion formation. In this study, we report a novel 3-Tesla RT-MRI based porcine RF ablation model and visualization of lesion formation in the atrium during RF energy delivery.
Objective
To develop of a 3-Tesla RT-MRI based catheter ablation and lesion visualization system.
Methods
RF energy was delivered to six pigs under RT-MRI guidance. A novel MRI compatible mapping and ablation catheter was used. Under RT-MRI this catheter was safely guided and positioned within either the left or right atrium. Unipolar and bi-polar electrograms were recorded. The catheter tip-tissue interface was visualized with a T1-weighted gradient echo sequence. RF energy was then delivered in a power-controlled fashion. Myocardial changes and lesion formation were visualized with a T2-weighted (T2w) HASTE sequence during ablation.
Results
Real-time visualization of lesion formation was achieved in 30% of the ablations performed. In the other cases, either the lesion was formed outside the imaged region (25%) or lesion was not created (45%) presumably due to poor tissue-catheter tip contact. The presence of lesions was confirmed by late gadolinium enhancement (LGE) MRI and macroscopic tissue examination.
Conclusion
MRI compatible catheters can be navigated and RF energy safely delivered under 3-Tesla RT-MRI guidance. It is also feasible to record electrograms during RT imaging. Real-time visualization of lesion as it forms during delivery of RF energy is possible and was demonstrated using T2w HASTE imaging.
Keywords: Atrial fibrillation, catheter ablation, radiofrequency energy, real-time MRI, lesion visualization
Introduction
Radiofrequency (RF) ablation1 has evolved from a primitive procedure to the mainstay for arrhythmia management it is today2. As progress was made in the understanding of the mechanisms underlying arrhythmias the limitations of fluoroscopy and conventional mapping techniques became apparent. EAM allows for three-dimensional (3D) cardiac chamber reconstruction, spatial catheter localization, tissue characterization based on local electrograms (EGMs) and electrophysiological tissue properties, and assessment of adequate RF energy delivery. Reduction in local tissue EGM voltage remains a widely used, albeit indirect, method to assess for adequate lesion formation. EAM has become the cornerstone of modern, complex cardiac ablations.
A more effective endpoint for RF ablation would be direct, real-time, visualization of myocardial destruction to assess lesion formation during ablation. Magnetic resonance imaging (MRI) allows for the assessment of location and extent of RF ablation lesion, and scar formation in the myocardium3. However, assessment of lesion formation during delivery of RF energy has remained elusive. Recently, several groups4–7 have reported MRI tracking of catheters within the cardiac chambers with successful delivery of RF energy and post-procedure visualization of lesion formation in 1.5-Tesla scanners. This is feasible using MRI; however, to the best of our knowledge, the ability to combine RT-MRI tracking of electrophysiology (EP) catheters and recording of EGMs, with actual tissue and lesion formation visualization during RF ablation has not been described yet. A system integrating these would prove valuable since it would allow visualization of a “hard” end-point to ablation: direct, real-time, visualization of myocardial scar formation and its correlation with changes in tissue electrophysiologic properties.
In this study we report a novel 3-Tesla RT-MRI guided catheter tracking system combined with a unique RT-MRI sequence and a new T2-weighted (T2w) sequence, which have allowed us to successfully and safely position an EP catheter within the atriae, record intra-cardiac EGMs, and ablate while simultaneously visualizing real-time, the RF myocardial lesion as it is being formed.
Methods
1. Catheter description and energy delivery
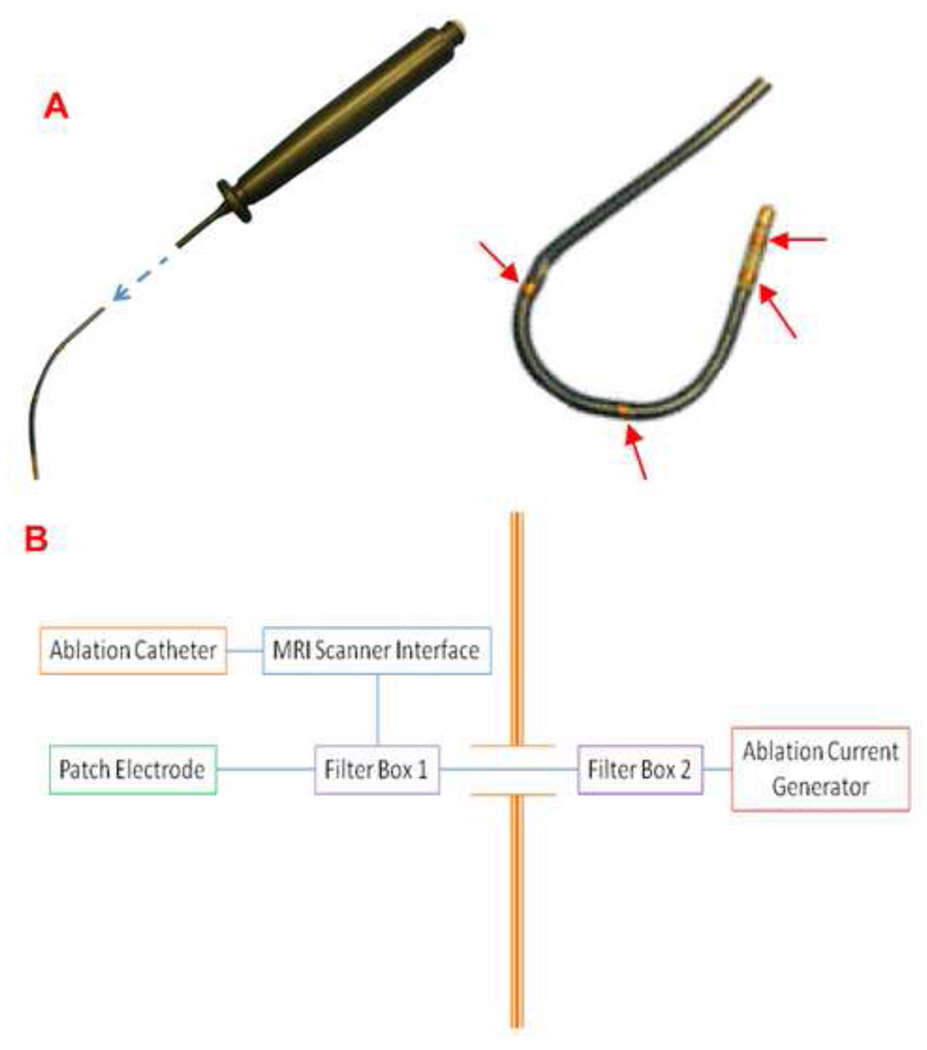
A 110cm 7F, 3mm tip, steerable, MRI compatible ablation catheter (SurgiVision Inc., Irvine, CA, USA) was designed to deliver RF energy under 3-Tesla RT-MRI. The catheter offered impedance monitoring, unipolar and bipolar EGM recording, and was able to deliver up to 40W of energy in a power-controlled mode. It had four tracking micro-coils. Figure 1A depicts a prototype EP-MRI catheter with a close up demonstrating the catheter tip and the tracking coils in a deflected catheter.
Figure 1. Prototype of the MRI compatible ablation catheter and schematic set up of the ablation delivery system and components inside and outside the EP-MRI suite.
(A) A 7F, 110 cm, MRI compatible radiofrequency ablation catheter. The catheter uses a plunger mechanism for deflection, the four tracking micro-coils are shown by the red arrows. (B) Setup for ablation and radiofrequency delivery system. The ablation catheter, MRI scanner interface, MRI scanner, patch electrode and one of the filter boxes are in the EP-MRI suite; and a second filter box and a standard ablation current generator are housed outside.
Intracardiac EGM signal recording was acquired directly from the catheter, passed through a custom-built amplifier/filter. A filter with a pass-band between 30 and 500 Hz was used; the signal was then displayed and stored electronically. Surface electrocardiographic tracings were directly obtained from the Veris-MR monitor (Medrad Inc., Warrendale, PA, USA), and were displayed over the intra-cardiac recordings allowing timing of the EGMs.
Electrical isolation between the MRI scanner and catheter was achieved by using custom low pass filters. The layout in which components inside the MR suite are connected to the components outside through a waveguide built into the RF shield that encloses the entire MRI suite is shown in Figure 1B. The catheter was connected to a standard ablation unit (Stockert-70 RF-generator, Biosense-Webster, Diamond Bar, CA, USA) with custom-built MR compatible interface circuits.
2. Electrophysiology MRI interventional suite
Imaging and ablations were performed in an Electrophysiology-MRI (EP-MRI) suite, equipped with a 3-Tesla Siemens Verio scanner (Siemens Healthcare, Erlangen, Germany), adjacent to the conventional EP suite. The animals were transferred between the EP-laboratory and the EP-MRI suite, using a system of rails (Siemens Angio-MR Miyabi, Siemens Healthcare, Erlangen, Germany).
Four projectors attached to the MRI-host and RT-MRI computers, ablation unit and telemetry system, projected their images through waveguides onto MRI compatible projection panels inside the EP-MRI suite. These images provided the operator in the MRI suite with the same real-time information that the MRI physicist/technologist had outside of the room.
Hearing protection and communication with the personnel outside was achieved with a fiber-optic communication system (Opto Acoustics Inc., Or-Yehuda, Israel).
3. Animal experiments
Six female pigs were used for this study. All animals were between 6 months to a year old. The animal mean weight was 40.4 ± 10 kg. Animal protocols were approved by the Institutional Animal Care and Use Committee.
Anesthesia was induced and maintained with IV sodium pentobarbital. The animals were mechanically ventilated during the experiment. Monitoring of vital signs was performed using a Veris vital signs monitor. IV access was obtained via surgical cut down. In two of the six animals, left atrial access was obtained. Trans-septal puncture was performed with an MRI compatible sheath under intra-cardiac echocardiography and fluoroscopy guidance. Following trans-septal the animals were then transferred to the EP-MRI suite.
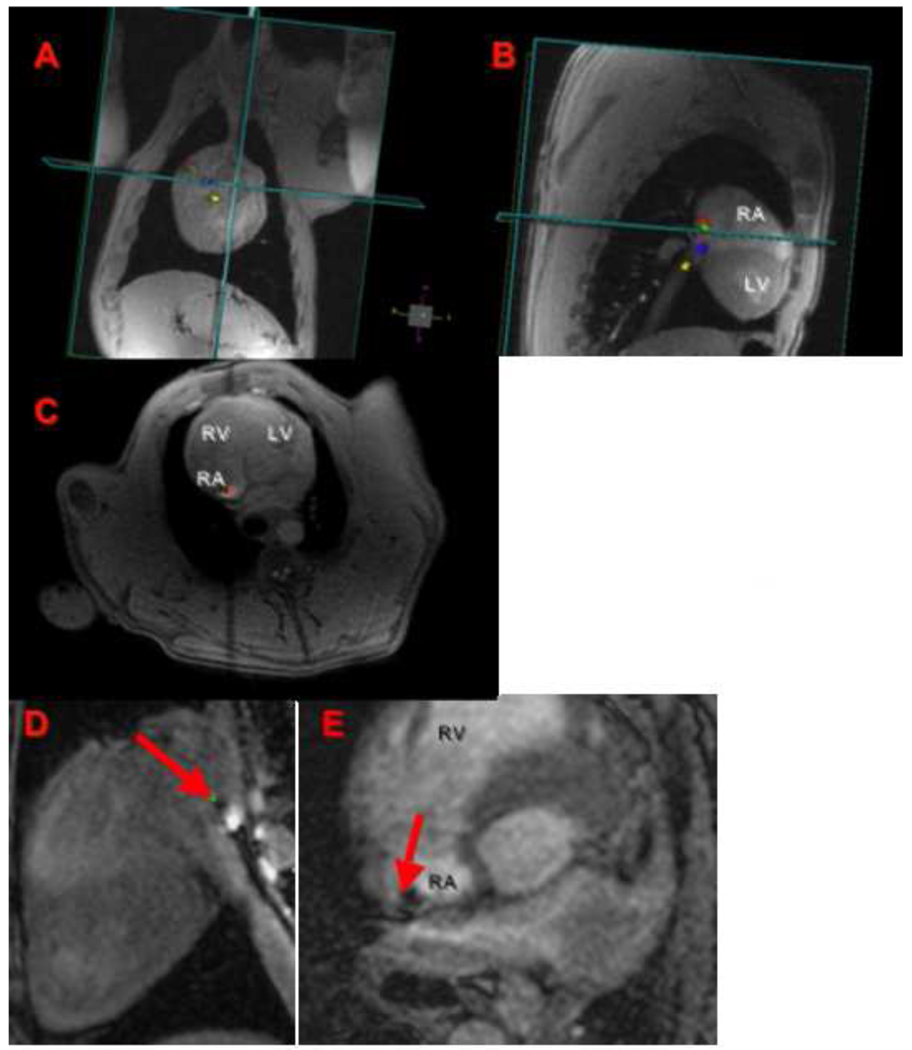
Standard spine and body array coils (Siemens Healthcare) were used for imaging. The real-time sequence and T2-weighted HASTE (half Fourier acquisition with single-shot turbo spin echo) sequences were optimized for the animal’s heart rate, optimal tissue-blood contrast, and fat suppression. The MRI-compatible ablation catheter was then advanced into the right or the left atrium under RT-MRI guidance (Figure 2A–2C). Once within the atria, different locations suitable for RF lesion delivery were chosen.
Figure 2. Assessment of catheter tip position and catheter tip-tissue interface by RTMRI and FLASH sequences.
An MRI compatible catheter is guided under RT-MRI (A–C) from the inferior vena cava to the lateral wall of the RA, this is seen in orthogonal planes (coronal, sagital, and axial views). The tip of the ablation catheter touching the atrial wall (red arrow) is seen in high-resolution T1w-FLASH images (D–E). RA: right atrium, LA: left atrium, RV: right ventricle, and LV: left ventricle.
4. MR Imaging and lesion visualization
The catheter was visualized during navigation with a RT-MRI sequence (RF-spoiled GRE pulse sequence with a frame rate of 5.5 fps). RT images were acquired sequentially on multiple slices and rendered in 3D space at their respective locations. This allowed device-only projection views to show the parts of the catheter outside the imaging planes8. Typical scan parameters for RT-GRE sequence were: echo time (TE) = 1.5 ms, repetition time (TR) = 3.5 ms, flip angle = 12°, slice thickness of 4 mm, resolution = 1.8 × 2.4 mm, image matrix of 192 × 108, bandwidth of 650 Hz/pixel, and parallel imaging with a reduction factor (R) = 2.
Once the catheter was in position for ablation, its tip was located using a T1w-FLASH sequence in two orthogonal planes (Figure 2D and 2E). Typical scan parameters for this 3D FLASH sequence were: EKG triggered, TE/TR = 1.2/2.8 ms, flip angle = 12°, slice thickness of 2.5mm, resolution 1.25 × 1.5 mm, image matrix of 240 × 180 × 12, bandwidth of 870 Hz/pixel and parallel imaging with R = 2. This scan was performed during breath-hold and typical scan time was 12–18 seconds. This sequence allowed high-resolution visualization of the catheter tip-myocardium interface. The arrows in Figures 2D and 2E point to a dark spot corresponding to the tip of the catheter.
Images during the actual RF energy delivery were acquired using an EKG triggered, respiratory gated T2w-HASTE sequence. The HASTE sequence parameters were: TE = 79 ms, TR = 1 respiration cycle, 3 contiguous slices with thickness of 4 mm, resolution = 1.25 × 1.78 mm, fat saturation and parallel imaging with R = 2.
At the end of the ablation, 0.2 mmol/kg MRI contrast (Multihance, Bracco Diagnostic Inc., Princeton, NJ) were injected and LGE images acquired 20 minutes later with a respiratory-gated 3D acquisition as previously described9,10. The atria were then segmented from the 3D-LGE images and a maximum-intensity projection image was generated to localize and compare the ablation lesions with the results seen on the gross specimens. This last set of images was used to confirm the presence of lesions visualized during ablation with the T2w-HASTE sequence. As previously described by our group11 and others12 LGE imaging can be used to detect post-ablation scar in the atrial wall.
5. Tissue and macroscopic examination
Following the experiment, the animals were euthanized with IV potassium-chloride. The animal chest was opened and the lungs, pericardium and heart inspected. The heart was then harvested and opened for macroscopic inspection. The right atrium was opened with a linear incision connecting the superior with the inferior vena cava and the left atrium with a line transverse to the roof and lateral wall or by incision around ventricular side of the tricuspid and mitral annulus. Lesion characteristics were observed directly on the gross specimens; lesion measurements (the largest linear dimension) were then made and correlated with the lesion size observed on T2w-HASTE imaged at different time points from start of RF energy delivery. The ex-vivo and MRI based measurements were performed in a blinded fashion by two experts.
Results
1. Catheter testing, navigation, and recording of intra-cardiac electrograms
The catheter underwent heat testing at 3-Tesla, and found to be less than 2 degrees above baseline during RT-MRI. The tracking elements allowed for catheter visualization during navigation. Navigation was tried at different frame rates by different operators. It was found that 5.5 fps provided a reasonable balance between good visual resolution and imaging time for all operators. Hence, our RT-MRI guidance was performed using a real-time GRE pulse sequence at 5.5 fps.
Intracardiac recordings
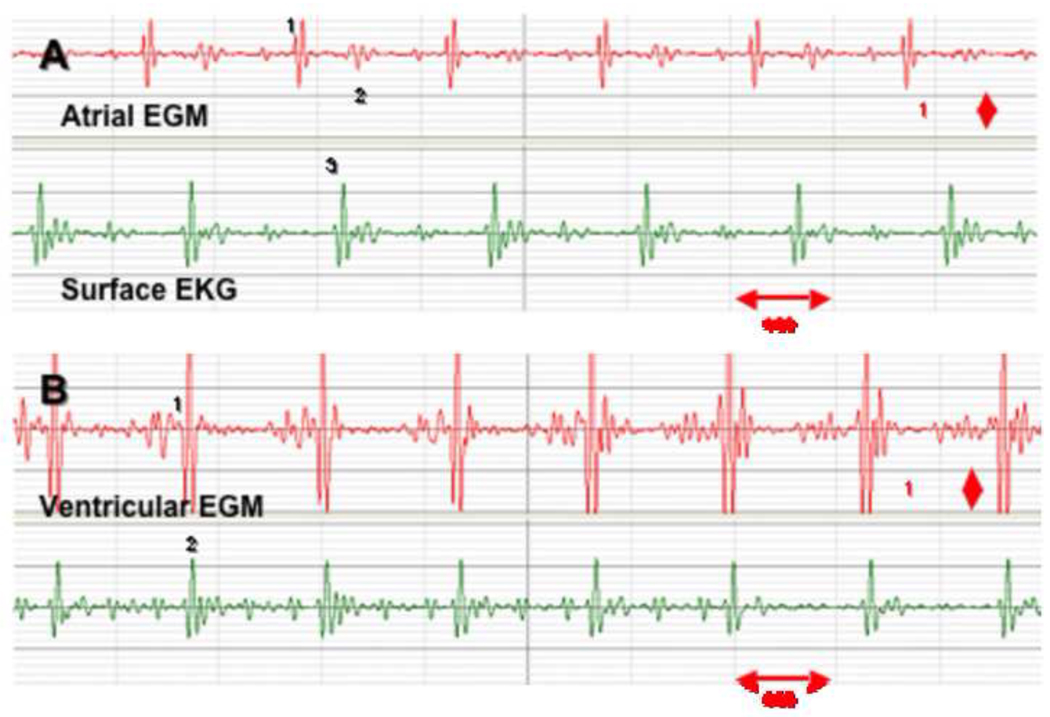
Unipolar and bipolar intra-cardiac EGMs were recorded during RT-MR imaging. Figure 3 shows two typical bipolar atrial and ventricular EGMs obtained with the catheter, super-imposed on a surface EKG recording.
Figure 3. Bipolar atrial and ventricular intra-cardiac recordings obtained during RT-MRI scanning.
The tracing on top (red) represents an atrial bipolar intra-cardiac electrogram (1) and a far-field ventricular signal (2); the presence of the QRS (3) on the surface EKG (green) confirms the timing and location of these recordings (panel A). The tracing on top (red), demonstrates a ventricular bipolar intra-cardiac electrogram (1) superimposed (2) with a surface QRS (panel B).
Catheter tracking
The catheter had four tracking micro-coils for guidance during RT-MRI. The most distal tracking coil was 5 mm from the catheter tip. The signal from these tracking devices was color coded (distal: red, proximal: yellow, and blue and green in the middle) to allow the operator to clearly identify each portion of the distal end of the catheter (Figure 2A–2C).
2. MRI sequences and image acquisition
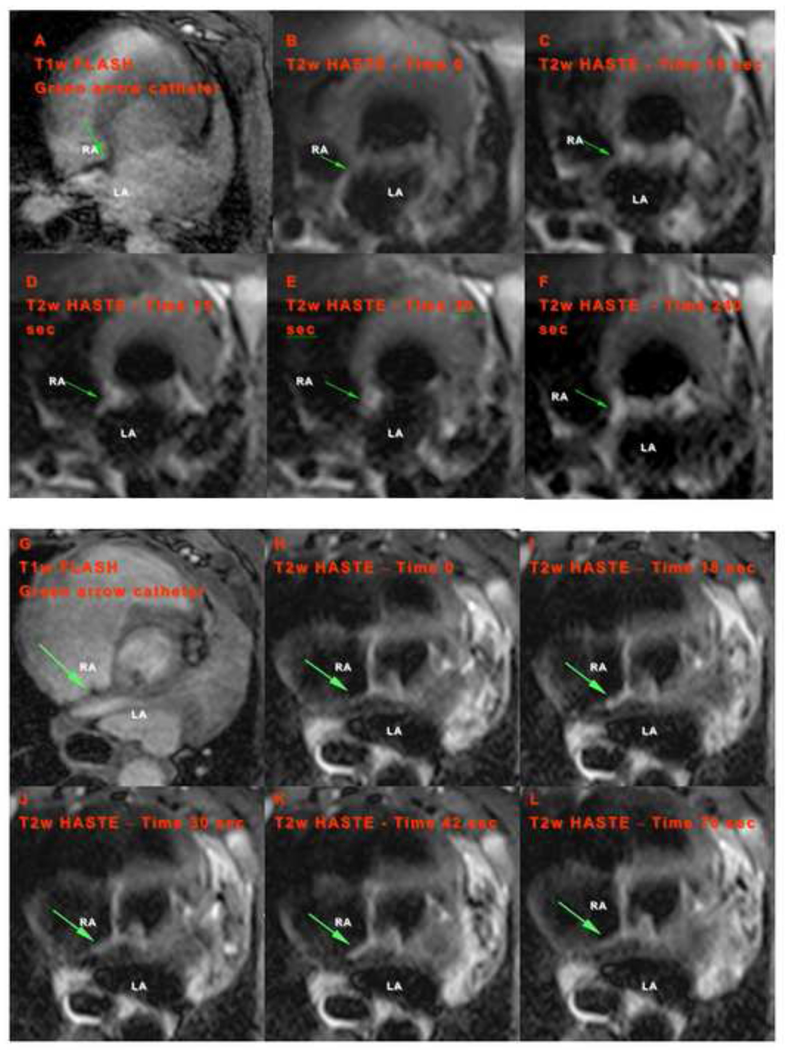
Resolution of the RT sequence did not allow for accurate detection of the catheter tip position. This was overcome by using high-resolution 3D T1w-FLASH scan in orthogonal planes for catheter tip-myocardium interface visualization (Figure 2D, 2E). The location of the image volume for this T1w-FLASH scan was obtained from RT-MRI images. Subsequently, the position of the catheter tip detected from T1w-FLASH images was used to prescribe the T2w-HASTE slices for myocardial tissue/injury visualization during RF energy delivery (Figure 4). By performing this stepwise approach we were able to localize specific points within the atrium, and deliver RF lesions while simultaneously visualizing the tissue for immediate assessment of tissue injury and lesion formation. Figure 4 shows the localization of catheter tip using the T1w-FLASH sequence, followed by the same location acquired using the T2w-HASTE sequence. The arrow indicates a position of catheter tip (in this case at the septal wall) within the atrium where RF energy was delivered.
Figure 4. Catheter tip-tissue interface imaging and lesion formation visualization on the atrial septum.
(A,G) Catheter tip localization from T1w-FLASH sequence. Green arrow indicates the position of catheter tip. (B–F and H–L) Temporal progression of lesion formation in the RA visualized by T2w-HASTE during RF energy delivery (20W, 120sec and 20W, 90sec respectively). Time after start of the ablation is shown in each image: (B) at the beginning of ablation and (C–F) at 10, 15, 30 and 240sec after the start of the ablation, respectively; (H) at the beginning of ablation and (I–L) at 18, 30, 42 and 78sec from the start of ablation respectively. RA: right atrium, and LA: left atrium.
Tissue edema and injury were visualized almost immediately after initiation of RF energy delivery to the atrial myocardium. LGE-MRI imaging post-ablation confirmed the presence of a lesion. Figure 4 demonstrates the typical progression of lesion formation after the first few seconds of power-controlled RF energy delivery throughout 120 seconds13.
3. Animal experiments and tissue examination
Energy delivery characteristics
Twenty ablations were performed using RF application in the right and left atria under MRI guidance. Ablations in the right atria included: a single ablation with 15W for 60sec at 175 Ohms impedance; nine with 20W for a mean time of 67sec (range 25–120sec) and mean impedance of 117 Ohms (range 99–142 Ohms); and three using 25W with a mean time of 41sec (range 22–60sec) and mean impedance of 145 Ohms (range 137–160 Ohms). Ablations in the left atrium included: a single ablation with 15W for 20sec; three using 20W with a mean time of 60sec; and three using 25W with a mean time of 50sec (range 22–60sec).
Lesion visualization, size and temporal behavior
Six lesions (30%) (four in RA and two in LA) were successfully visualized during ablation. All lesions visualized acutely during RF energy delivery as they formed and were later confirmed with LGE imaging and ex-vivo examination. Nine ablations did not create any lesions presumably due to poor catheter-tissue contact. Five lesions were not seen during ablation (four in RA and one in LA). For these five lesions, the ablation site was one to two slice planes away from the acquired HASTE imaging plane, resulting in imaging a different area than that ablated. The lesions were visualized 90–120 seconds post ablation when a larger volume was imaged using T2w-HASTE. Good catheter tip-tissue contact, and accurate detection and imaging of catheter tip position were critical steps for successful visualization of lesion formation during ablation.
The earliest stages of lesion formation during power controlled RF energy delivery were visualized with the use of T2w-HASTE sequence (Figures 4B–4F and 4H–4L). As early as 10–15 seconds after the start of ablation, tissue enhancement (associated with injury) was seen in the atrial wall. Initially, a focal T2w signal was seen at the site (Figure 4C–4E) with little to no signal in the adjacent tissue. Four minutes after RF energy delivery, repeat T2w imaging showed persistent signal intensity consistent with lesion formation at the ablation site (Figure 4F). The temporal changes in the tissue reflect acute edema and inflammation triggered by heat injury. LGE-MRI imaging post-ablation confirmed the presence of a lesion. Figures 4 (B–F) and (H–L) demonstrate the typical progression of lesion formation.
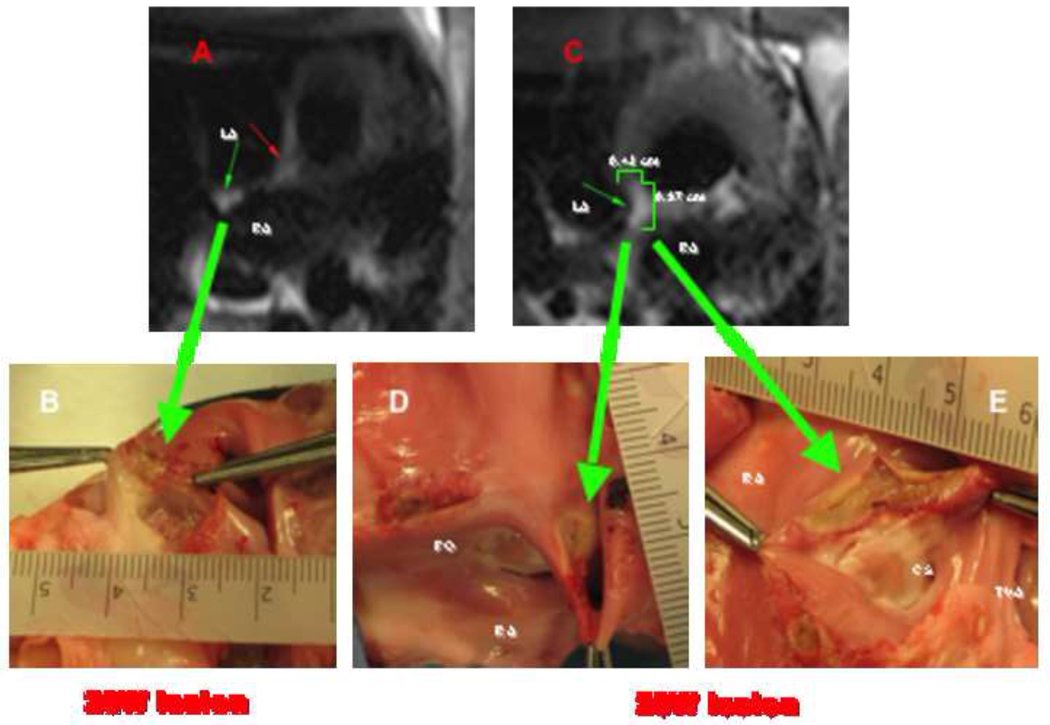
As expected, lesion size and depth increased with the duration of energy delivery. There was a positive correlation between total duration of energy delivery and lesion diameter and depth. This correlation is illustrated by Figure 5. Here a power-controlled 20W lesion for 90sec (impedance 100 Ohms) in the posterior wall of the right atrium is seen; this lesion measured approximately 5 mm in diameter by 2 mm in depth. Figure 5 also shows a 20W power-controlled 120sec lesion on the cavo-tricuspid isthmus; this lesion was larger than the previous one, measuring approximately 10 mm in diameter by 4 mm in depth. This was evident on T2w-HASTE sequence imaging of the lesion and on macroscopic examination.
Figure 5. Correlation between RT-MRI findings during lesion formation (T2w-HASTE) and macroscopic tissue samples.
(A) T2w-HASTE image acquired 20 seconds from the start of a 20W ablation for 90sec (impedance 100 Ohms) shows a lesion in the posterior wall of the RA (small green arrow). This lesion measured approximately 5 mm in diameter by 2 mm in depth on macroscopic examination, large green arrow on (B). On (C) a T2w-HASTE image sequence acquired obtained during the first 20 seconds from the start of a 20W ablation for 120sec (impedance 95 Ohms) shows a lesion in the cavo-tricuspid isthmus. This lesion measured approximately 10 mm in diameter by 4 mm in depth on macroscopic examination, large green arrows on (D) and (E). LA: left atrium, RA: right atrium, FO: fosa ovalis, CS: coronary sinus os, and TVA: tricuspid valve annulus.
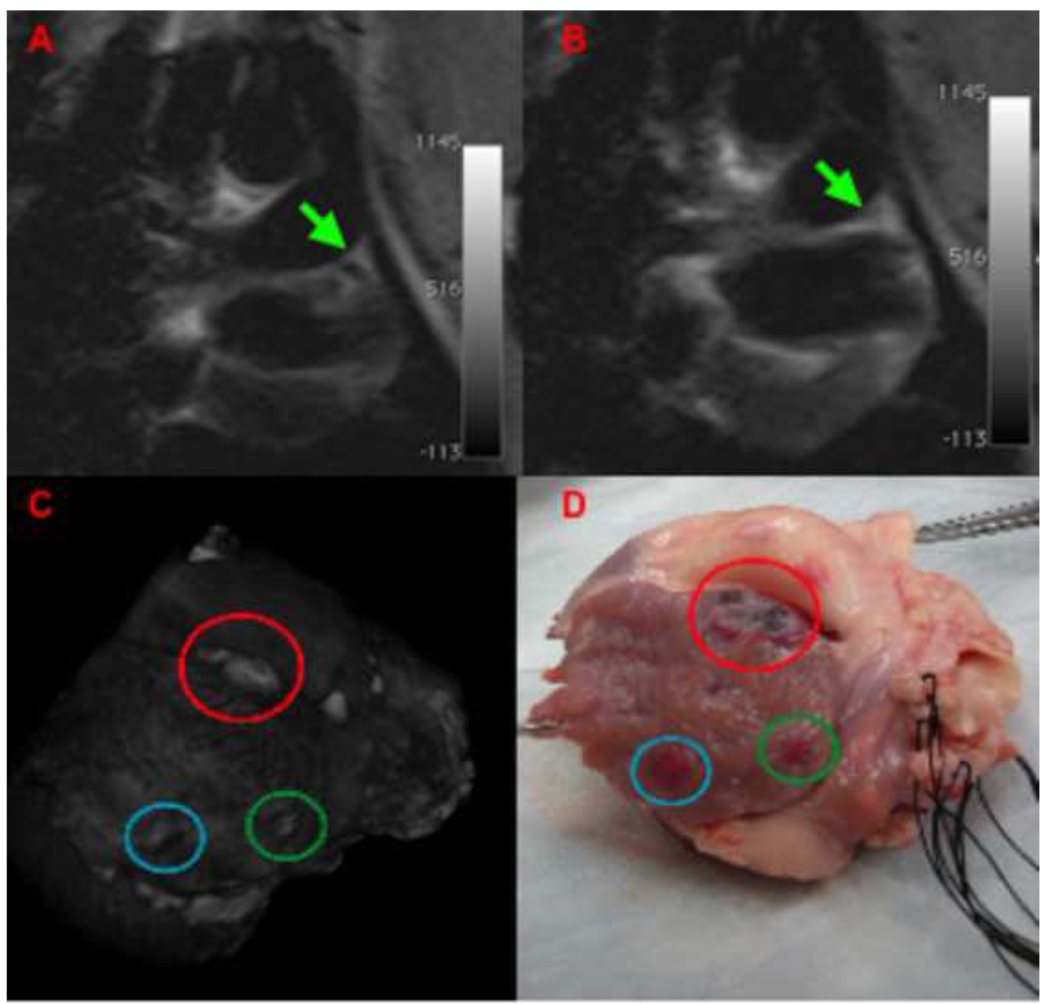
The trans-mural extent of the lesions in the left atrial appendage was clearly visualized by T2w-HASTE sequences and the extent compared well with macroscopic tissue examination and ex-vivo LGE imaging (Figure 6).
Figure 6. Correlation between T2w-HASTE images of lesion formation and 3D reconstruction based on LGE-MRI and macroscopic tissue examination in the left atrium.
(A,B) T2w-HASTE images of RF ablation in left arial appendage (LAA). The green arrow points to the catheter tip (A) and the lesion (B) being formed in the LAA after power-controlled ablation (20W, 30sec). (C) Segmented, 3D rendered image of an ex-vivo LGE MRI scan demonstrating lesions in LAA, blue circle corresponds to the lesion depicted in (B). In LGE imaging a dark area is visualized consistent with hematoma/hemorrhage within the atrial wall. (D) Macroscopic specimen demonstrating the lesion.
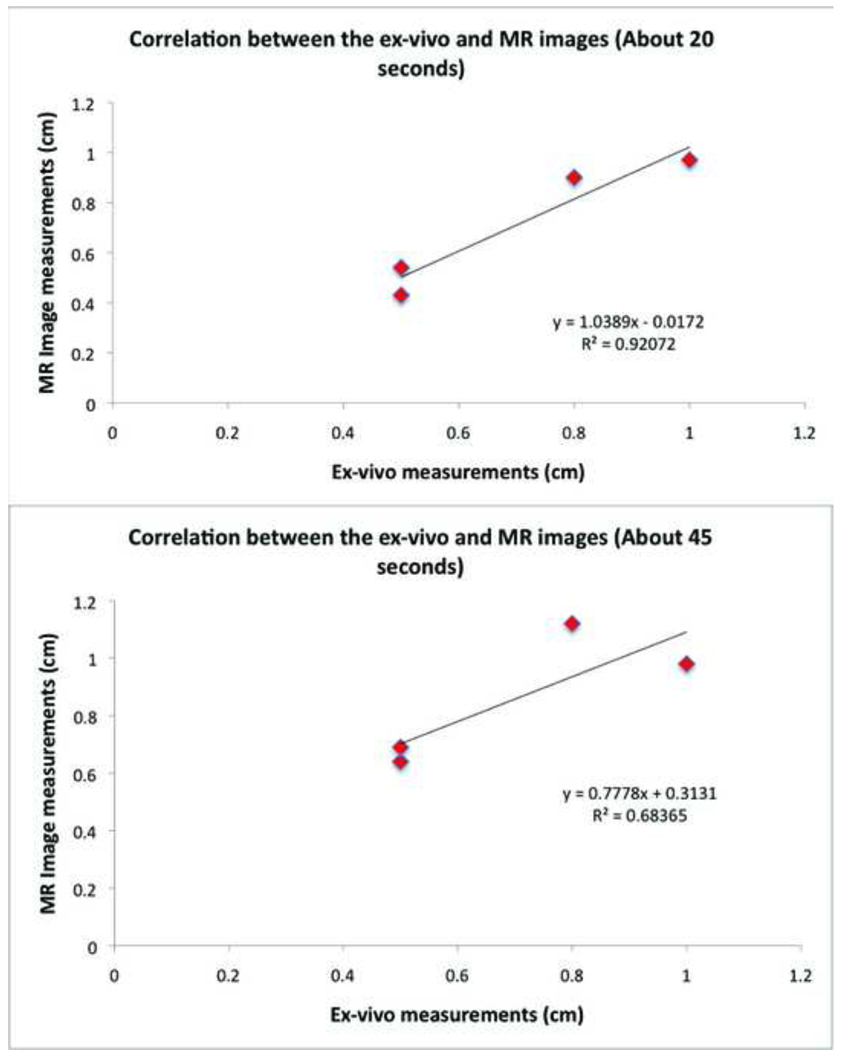
Multiple T2w-HASTE images were acquired at different time points following the start of RF energy delivery. Four of the six real time visualized lesions were used to compare measurements in MRI and ex-vivo. Table 1 compares the MRI measurements made from 4 different RA lesions (primarily on the septal wall and lateral wall) created with similar ablation parameters (20W, 60sec) at two different time points during RF energy delivery (the largest linear dimension of enhancement on T2w-HASTE imaging) to similar measurements made ex-vivo. The two LA lesions were not used for this correlation, because on one of the animal’s ex-vivo examination, the incision made was such that the lesion was cut off; while the other one, in the appendage, could not be measured accurately ex-vivo due to the fine tuberculation in the tissue. Figure 7 shows the correlation curves plotted from these measurements made at about 15–20seconds from the start of ablation and about 30–40seconds from start of ablation. This figure demonstrates that the earliest observed tissue changes, typically within 15–20seconds of starting RF energy delivery, correlate well to the ex-vivo lesion measurements. Also since T2w-HASTE mainly visualizes tissue edema, and edema is known to spread farther out than the region of acute injury with time, images acquired later from the start of ablation are more likely to overestimate the true size of the lesion. Our results, albeit limited, indicate that for a 20W power delivery, the T2w-HASTE images acquired about 20seconds from start of ablation show better correlation to actual lesion measurements ex-vivo (R=0.92) than the ones acquired about 45seconds (R=0.68) from the start of ablation.
Table 1.
Lesion size from T2w HASTE and ex-vivo measurements.
| Lesion # | Ex-vivo Measurement (cm) |
Time of first T2w image |
Measurement on first T2w image (cm) |
Time of second T2w image |
Measurement on second T2w image (cm) |
|---|---|---|---|---|---|
| 1 | 0.8 | 18 sec | 0.9 | 30 sec | 1.12 |
| 2 | 0.5 | 21 sec | 0.43 | 60 sec | 0.64 |
| 3 | 1.0 | 15 sec | 0.97 | 30 sec | 0.98 |
| 4 | 0.5 | 14 sec | 0.54 | 27 sec | 0.69 |
Figure 7. Correlation between enhancement size in T2w-HASTE MRI (vertical axis) and ex-vivo measurements (horizontal axis) of lesion for four 20W power-controlled lesions.
A correlation coeficient of 0.92 was found for the T2w-HASTE images acquired approximately 20 seconds after beginning of ablation (top panel); and a correlation coeficient of 0.68 for the T2w-HASTE images acquired approximately 45 seconds after beginning of ablation (bottom panel). Table 1 shows the actual MRI and ex-vivo lesion size measurements.
4. Safety
No obvious cardiac perforation or pericardial effusion was seen during the studies. Two of the animals developed ventricular tachycardia/fibrillation with cardiac arrest, which were readily seen in the real-time images and electrogram traces obtained during the study. No correlation between RF energy delivery and VF/VT could be established in these animals. The animals were quickly resuscitated by defibrillation and survived to complete the study.
Discussion
MRI guided ablation within the atrium has recently been reported by other groups6,7. In one of these studies, MRI angiography of the atrium was acquired, the atrium surface was then segmented, and real time catheter navigation was then carried out using this 3D reconstruction; however, no images were acquired during ablation6; rather, immediately post-ablation lesion formation was confirmed by LGE imaging. In the other study7, the catheters were navigated using RT-MRI sequences; however, there was no immediate tissue visualization during RF delivery and lesion formation, although there was T2w evaluation of the ablation site just before and after the ablation of the cavo-tricuspid isthmus. Additionally, these two previous studies were done in 1.5-Tesla MRI.
To our knowledge, this is the first study to demonstrate real-time visualization of atrial ablation lesion formation using a 3-Tesla MRI. We demonstrated feasibility to navigate in the right and left atrium under 3-Tesla RT-MRI guidance with good catheter visualization, providing adequate temporal and spatial resolution. We were able to create lesions using RF energy delivered to the atrial myocardium while imaging the atrial tissue (with T2w-HASTE) as the lesions formed.
Imaging of lesion formation during and after ablation presented its challenges due to cardiac and respiratory motion; this was overcome with the use of the respiratory-gated single-shot HASTE sequence. This allowed us to visualize the effect of RF energy within the atrium. Brightness on T2w images corresponds to edema13, with progression to tissue destruction14, and scar formation, as evidenced by LGE12. All the lesions visualized using T2w-HASTE were validated with post-ablation LGE-MRI and ex-vivo examination of the heart.
We were able to demonstrate a correlation between ablation time and lesion size under power-controlled RF energy delivery. This is in agreement with previously published data4. However, in this previous study, the time frame for imaging was much longer and the substrate was the ventricle, which is an easier target due to the thicker myocardial wall. Also, for a 20W power delivery, the size of enhancement observed by T2w-HASTE imaging at 15–20 seconds from the beginning of ablation had a good correlation with the dimensions (longest diameter and depth) of the lesion on macroscopic examination. Based on our limited data, T2w-HASTE imaging at later times from the start of ablation tends to overestimate lesion size by showing the surrounding edema.
Accurate lesion visualization in the atrium is still very challenging, and in our study it relied on accurate detection of catheter tip position using a high resolution T1w-FLASH sequence and subsequently imaging this spatial location using a T2w-HASTE sequence. In some of our experiments, changes in catheter position occurred during the time interval between acquisition of T1w-FLASH images and T2w-HASTE scan. Thus, real time visualization of the lesion formation was not always possible, likely because the T2w-HASTE slices did not cover the ablation location. However, even when slice alignment with catheter-tip was not feasible, after a 90 to 240 sec time lapse, it was possible to see lesion formation a few millimeters away from the assumed location.
Even when no specific arrhythmogenic substrate was targeted for ablation in our study, we believe that its importance lies in the possibility, for the first time, to visualize lesion formation as it happens in the atrium.
In summary, we developed a series of tools to navigate and guide an ablation catheter in a 3-Tesla RT-MRI scanner within the right and left atrium in a porcine model, record intra-cardiac electrograms while scanning, and deliver RF energy while simultaneously visualizing the atrial myocardium to assess for the presence of lesion formation. We were also able to correlate these very early visualized lesions on T2w images with LGE-MRI obtained from live and ex-vivo hearts, and anatomic tissue examination (Figures 7 and 8). This new technology presents many challenges, and there are many shortcomings to its application, such as inability to monitor catheter tip temperature, high fidelity EGM and surface EKG recording during MRI scanning, and difficulty visualizing lesion formation in real time in many cases. Nonetheless, we believe that the work presented here is a significant advancement in the field of delivery and monitoring of RF ablation lesions, which could be potentially used as an endpoint in cardiac ablation procedures to improve outcomes.
Study Limitations
Catheter steerability
The initial prototypes of MRI compatible catheters have not been mechanically optimized to allow the operator to steer them to all parts of the atrium. Furthermore, only two standard catheter curves were available; this aspect is under continued development.
EGM recording and surface EKG recording
During EGM recording noise was present despite filtering. This prevented us from obtaining high fidelity EGM recordings. Due to scanner interference and non-standard surface lead placement, the elements of the surface EKG are difficult to distinguish. The QRS is visualized; however, its deflections, the P wave and T wave are not clearly seen. We are working towards a dedicated EKG system that would provide high fidelity recordings.
Catheter-tissue contact
To identify catheter-tip position and to confirm catheter tip-tissue contact, a T1w-FLASH sequence was used. On occasion, this proved to be challenging and a lesion could not be delivered and/or clearly visualized while delivering RF energy due to lack of contact between catheter tip and myocardium or misalignment between catheter tip position and T2w-HASTE slices. This could explain why only 11 out of 20 ablations resulted in lesion formation and six of these lesions were visualized in real-time.
Catheter temperature monitoring
The inability to monitor temperature real-time was a significant limitation. Nevertheless, we showed that despite the lack of temperature monitoring an appropriate myocardial lesion could be delivered and its progression monitored in real-time.
List of abbreviations
- 3D
three dimensional
- EAM
Electro-anatomical mapping
- EP
electrophysiology
- FLASH
fast low angle shot
- GRE
gradient recalled echo
- HASTE
half Fourier acquisition with single shot turbo spin echo
- ICE
intra-cardiac echocardiography
- IV
intravenous
- LGE
late gadolinium enhancement
- MRI
magnetic resonance imaging
- RF
radiofrequency
- RT
real-time
- T1w
T1-weighted
- T2w
T2-weighted
- TE
echo time
- TR
repetition time
- W
watt
Footnotes
Publisher's Disclaimer: This is a PDF file of an unedited manuscript that has been accepted for publication. As a service to our customers we are providing this early version of the manuscript. The manuscript will undergo copyediting, typesetting, and review of the resulting proof before it is published in its final citable form. Please note that during the production process errors may be discovered which could affect the content, and all legal disclaimers that apply to the journal pertain.
References
- 1.Mitsui T, Ijima H, Okamura K, Hori M. Transvenous electrocautery of the atrioventricular connection guided by the His electrogram. Jpn Circ J. 1978;42:313–318. doi: 10.1253/jcj.42.313. [DOI] [PubMed] [Google Scholar]
- 2.Andrikopoulos G, Tzeis S, Maniadakis N, Mavrakis HE, Vardas PE. Cost-effectiveness of atrial fibrillation catheter ablation. Europace. 2009;11:147–151. doi: 10.1093/europace/eun342. [DOI] [PubMed] [Google Scholar]
- 3.Dickfeld T, Kato R, Zviman M, et al. Characterization of acute and subacute radiofrequency ablation lesions with nonenhanced magnetic resonance imaging. Heart Rhythm. 2007;4:208–214. doi: 10.1016/j.hrthm.2006.10.019. [DOI] [PMC free article] [PubMed] [Google Scholar]
- 4.Nazarian S, Kolandaivelu A, Zviman MM, et al. Feasibility of real-time magnetic resonance imaging for catheter guidance in electrophysiology studies. Circulation. 2008;118:223–229. doi: 10.1161/CIRCULATIONAHA.107.742452. [DOI] [PMC free article] [PubMed] [Google Scholar]
- 5.Kolandaivelu A, Lardo AC, Halperin HR. Cardiovascular magnetic resonance guided electrophysiology studies. J Cardiovasc Magn Reson. 2009;11:21. doi: 10.1186/1532-429X-11-21. [DOI] [PMC free article] [PubMed] [Google Scholar]
- 6.Schmidt EJ, Mallozzi RP, Thiagalingam A, et al. Electroanatomic mapping and radiofrequency ablation of porcine left atria and atrioventricular nodes using magnetic resonance catheter tracking. Circ Arrhythm Electrophysiol. 2009;2:695–704. doi: 10.1161/CIRCEP.109.882472. [DOI] [PubMed] [Google Scholar]
- 7.Hoffmann BA, Koops A, Rostock T, et al. Interactive real-time mapping and catheter ablation of the cavotricuspid-isthmus guided by magnetic resonance imaging in a porcine model. Eur Heart J. 2010;31:450–456. doi: 10.1093/eurheartj/ehp460. [DOI] [PMC free article] [PubMed] [Google Scholar]
- 8.Gutman MA, Ozturk C, Raval AN, et al. Interventional cardiovascular procedures guided by real-time MRI: an interactive interface using multiple slices, adaptive projection modes and live 3D renderings. J Magn Reson Imaging. 2007;26:1429–1435. doi: 10.1002/jmri.21199. [DOI] [PMC free article] [PubMed] [Google Scholar]
- 9.Badger TJ, Adjei-Poku YA, Burgon NS, et al. MRI in cardiac electrophysiology: the emerging role of delayed-enhancement MRI in atrial fibrillation ablation. Future Cardiol. 2009;5:63–70. doi: 10.2217/14796678.5.1.63. [DOI] [PubMed] [Google Scholar]
- 10.Peters DC, Wylie JV, Hauser TH, et al. Detection of pulmonary vein and left atrial scar after catheter ablation with three-dimensional navigator-gated delayed enhancement MR imaging: initial experience. Radiology. 2007;243:690–695. doi: 10.1148/radiol.2433060417. [DOI] [PubMed] [Google Scholar]
- 11.Badger TJ, Daccarett M, Akoum NW, et al. Evaluation of left atrial lesions after initial and repeat atrial fibrillation ablation: Lessons learned from delayed-enhancement MRI in repeat ablation procedures. Circ Arrhythm Electrophysiol. 2010;3:249–259. doi: 10.1161/CIRCEP.109.868356. [DOI] [PMC free article] [PubMed] [Google Scholar]
- 12.Peters DC, Wylie JV, Hauser TH, et al. Recurrence of atrial fibrillation correlates with the extent of post-procedural late gadolinium enhancement: a pilot study. JACC Cardiovasc Imaging. 2009;2:308–316. doi: 10.1016/j.jcmg.2008.10.016. [DOI] [PMC free article] [PubMed] [Google Scholar]
- 13.Boxt LM, Hsu D, Katz J, et al. Estimation of myocardial water content using transverse relaxation time from dual spin-echo magnetic resonance imaging. Magn Reson Imaging. 1993;11:375–383. doi: 10.1016/0730-725x(93)90070-t. [DOI] [PubMed] [Google Scholar]
- 14.Lardo AC, McVeigh ER, Jumrussirikul P, et al. Visualization and temporal/spatial characterization of cardiac radiofrequency ablation lesions using magnetic resonance imaging. Circulation. 2000;102:698–705. doi: 10.1161/01.cir.102.6.698. [DOI] [PubMed] [Google Scholar]


