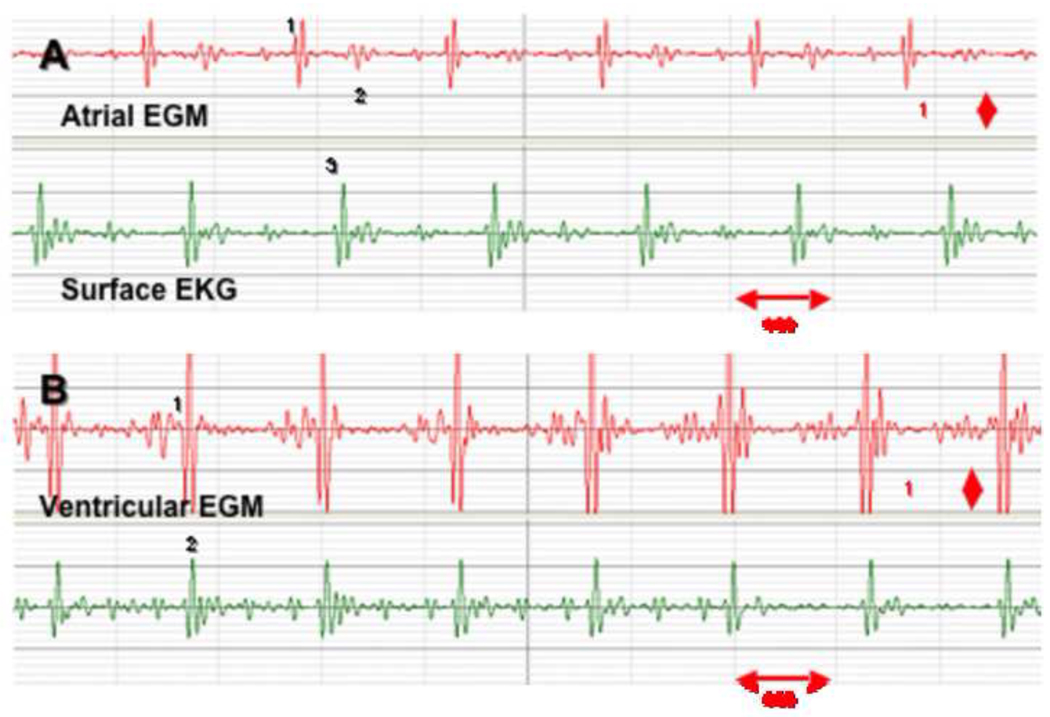
Figure 3. Bipolar atrial and ventricular intra-cardiac recordings obtained during RT-MRI scanning.
The tracing on top (red) represents an atrial bipolar intra-cardiac electrogram (1) and a far-field ventricular signal (2); the presence of the QRS (3) on the surface EKG (green) confirms the timing and location of these recordings (panel A). The tracing on top (red), demonstrates a ventricular bipolar intra-cardiac electrogram (1) superimposed (2) with a surface QRS (panel B).

