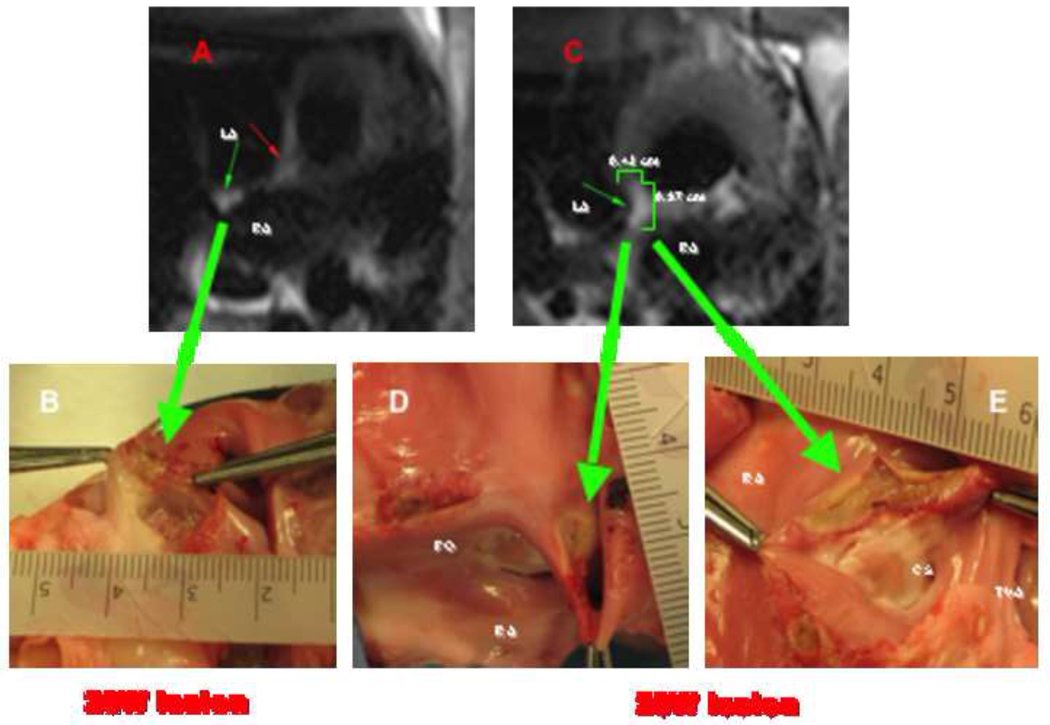
Figure 5. Correlation between RT-MRI findings during lesion formation (T2w-HASTE) and macroscopic tissue samples.
(A) T2w-HASTE image acquired 20 seconds from the start of a 20W ablation for 90sec (impedance 100 Ohms) shows a lesion in the posterior wall of the RA (small green arrow). This lesion measured approximately 5 mm in diameter by 2 mm in depth on macroscopic examination, large green arrow on (B). On (C) a T2w-HASTE image sequence acquired obtained during the first 20 seconds from the start of a 20W ablation for 120sec (impedance 95 Ohms) shows a lesion in the cavo-tricuspid isthmus. This lesion measured approximately 10 mm in diameter by 4 mm in depth on macroscopic examination, large green arrows on (D) and (E). LA: left atrium, RA: right atrium, FO: fosa ovalis, CS: coronary sinus os, and TVA: tricuspid valve annulus.

