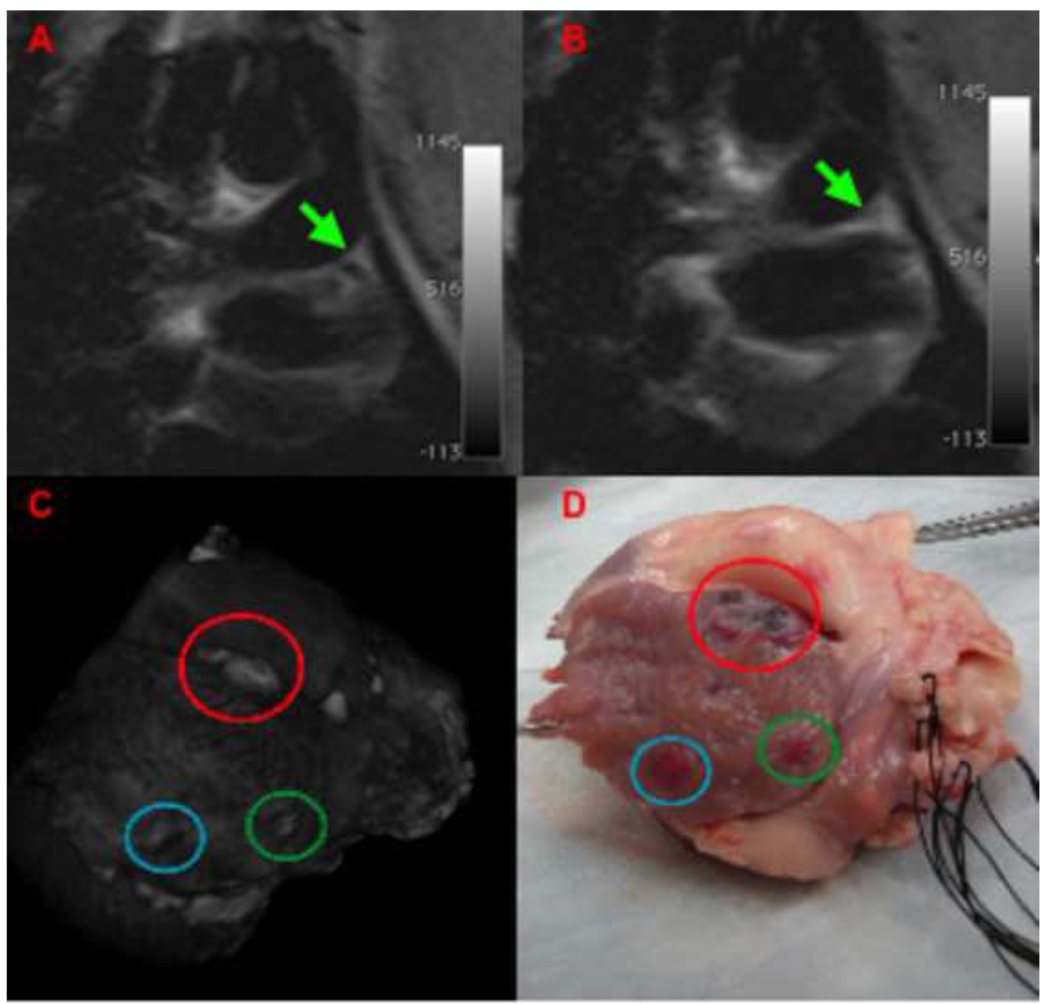
Figure 6. Correlation between T2w-HASTE images of lesion formation and 3D reconstruction based on LGE-MRI and macroscopic tissue examination in the left atrium.
(A,B) T2w-HASTE images of RF ablation in left arial appendage (LAA). The green arrow points to the catheter tip (A) and the lesion (B) being formed in the LAA after power-controlled ablation (20W, 30sec). (C) Segmented, 3D rendered image of an ex-vivo LGE MRI scan demonstrating lesions in LAA, blue circle corresponds to the lesion depicted in (B). In LGE imaging a dark area is visualized consistent with hematoma/hemorrhage within the atrial wall. (D) Macroscopic specimen demonstrating the lesion.

