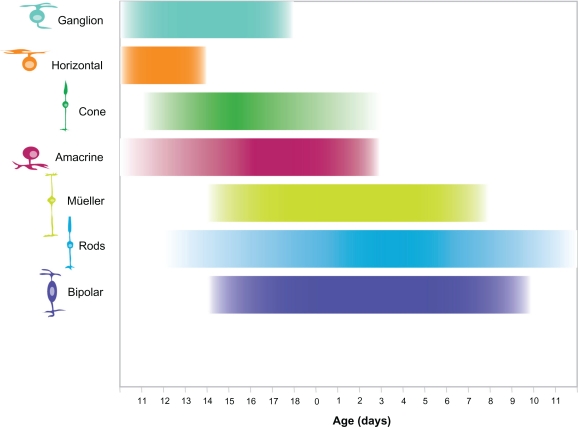
Figure 2.
Time course of cell genesis in the developing mouse retina. Retinal cell types are listed on the Y-axis, developmental time on the X-axis. Birth of the animal is indicated as 0, embryonic development is left of 0, postnatal development to the right. The approximate time course of cell genesis is indicated by the bar adjacent each cell type. This figure is based on the work reported by Young.8

