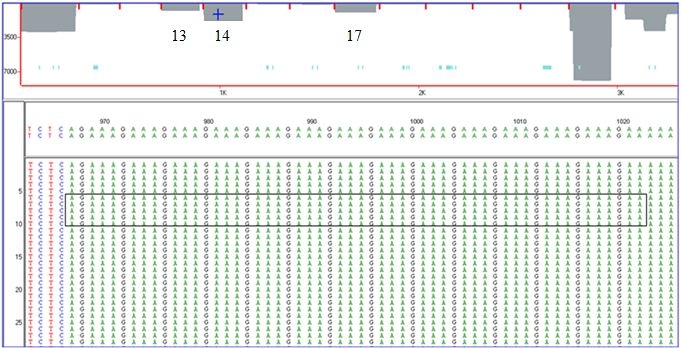
Figure 3.

Short tandem repeat results for the D18S51 locus of two samples mixed in a pre-polymerase chain reaction ratio of 1:1. The D18 profile for individual one was 13,14 and 14,17 for individual two. The 3 gray-shaded areas labeled in the figure are representative of the sequence density for alleles 13, 14, and 17; ~ 1000-2500 sequences for each allele. The cross above the 14 allele indicates which sequence is being displayed in the window below; sequences 1-28 for allele 14. The sequence density for allele 14 is illustrative of 2 doses of that allele. The area enclosed by the box in the window below is the 14 copies of the STR repeat, AGAA, for the 14 allele; for sequences 6-10. The numbered sequence above the window is a reference used to partition the sequences associated with the 14 allele away from other alleles.
