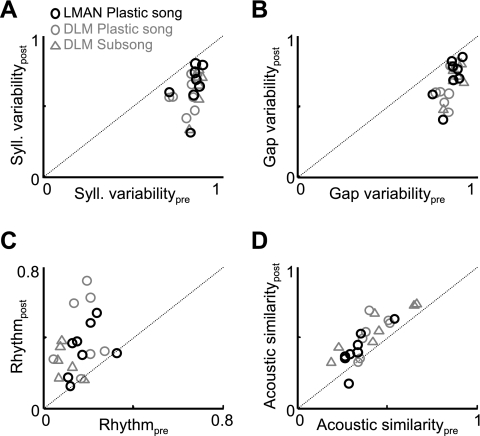
Fig. 5.
Quantitative comparison of DLM lesions and LMAN inactivations. Inactivation of LMAN was carried out as described in detail elsewhere (Olveczky et al. 2005). Data in A–D are plotted as in Fig. 3, K–N, comparing data from DLM lesions (n = 14, gray) side by side with data from LMAN inactivations from young plastic song birds (dph 45–56, black). A and B: scatterplots showing prelesion vs. postlesion variability of syllable (A) and gap (B) durations. C: scatterplot of song rhythmicity in pre- and postlesion song. D: average pairwise spectrogram cross-correlations in pre- and postlesion song.

