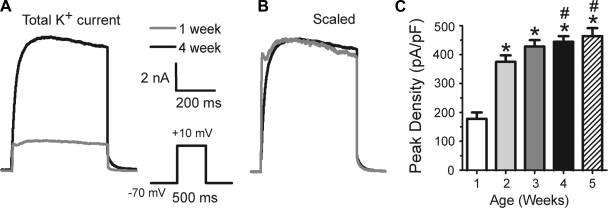
Fig. 2.
Changes in total outward current during postnatal development. A: examples of current recorded from a 1-wk-old animal and a 5-wk-old animal. Currents are shown at the same scale (inset on right). Note the A-type current in the 1-wk-old animal. B: same traces as in A, except scaled to the same peak amplitude. Except for the more rapid initial rise and early peak in the younger animal, the currents superimpose (suggesting no changes in kinetics of the persistent component). C: histogram for peak current density (current/Cm). *Significant difference from 1 wk; #significant difference from week 2. Number of cells: 1 wk, 20; 2 wk, 24; 3 wk, 32; 4 wk, 46; 5 wk, 21.

