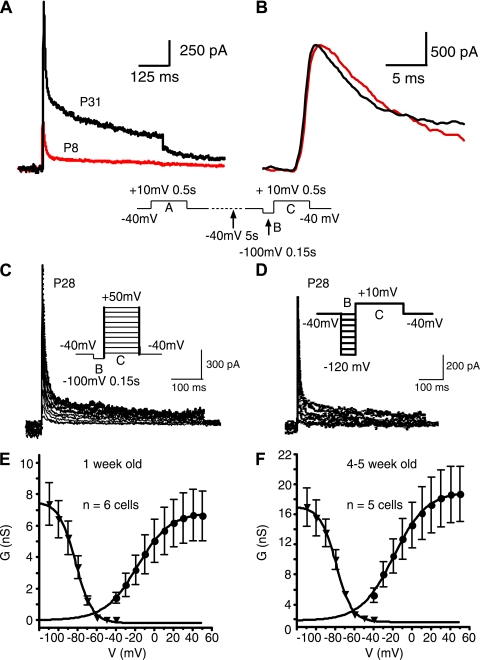
Fig. 7.
Activation and inactivation of A-type current at 1 wk and 4–5 wk of age. A: subtracted A-type current traces in the presence of 30 mM TEA (voltage protocol shown below traces). Black, cell from P31 animal; red, trace from P8 animal. B: expanded view of traces in A after normalization of peak current. Note slightly slower activation in P8 cell. C: steady-state activation. A family of subtracted traces is shown (obtained in 30 mM TEA). Protocol is identical to that in A and B except that the voltage was varied in 10-mV increments for the test pulse (step C in protocol). D: steady-state inactivation. A family of subtracted traces is shown (obtained in 30 mM TEA). Protocol is identical to that in A and B except that the recovery voltage was varied in 10 mV increments (step B in protocol). E: summary graphs for steady-state activation and inactivation for 1 wk-old animals (n = 6 cells for activation and 5 cells for inactivation). F: summary graphs for steady-state activation and inactivation for 4- to 5-wk-old animals (n = 5 cells). G, conductance; V, voltage.

