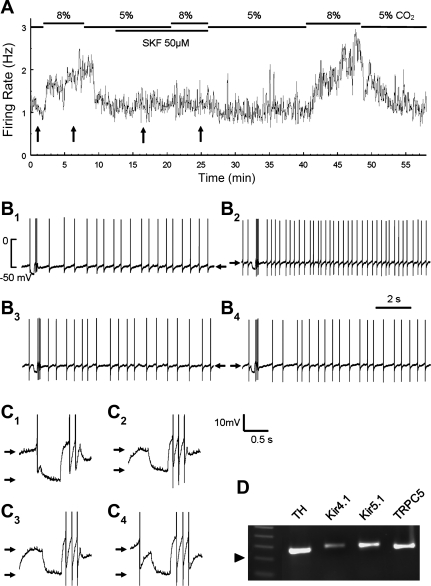
Fig. 6.
Blockade of the hypercapnic effects by the selective TRPC inhibitor SKF-96365 (SKF). A: instant-frequency histogram of an LC neuron. A clear increase in FR was seen with the exposure to 8% CO2. The hypercapnic effect was almost totally eliminated after a treatment of the cell with SKF. The augmentation of FR by high CO2 was resumed after washout. B, B1–B4: individual traces of action potentials and Vm (arrow) obtained from places in A pointed by the arrows from the left to the right, respectively. C, C1–C4: the decrease in Rm (between arrows) occurred before but not during SKF treatment. Traces are obtained from B in the same numbers accordingly. D: single-cell PCR analysis indicates that the cell is a TH-positive neuron and expresses the TRPC5 mRNA. The size of the PCR products is ∼250 bp (arrowhead: 200 bp).

