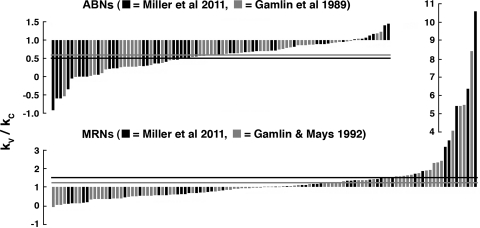
Fig. 8.
Distribution of kV/kC for ABNs and MRNs. Values of kV/kC are plotted as bars, in order of signed magnitude, along with comparable data from earlier studies. Solid and shaded horizontal lines show mean values of kV/kC for the present and earlier studies, respectively. ABNs with kV/kC < 1 and MRNs with kV/kC > 1 are “paradoxical” in the sense discussed in the text. It can be seen that the vast majority of ABNs have kV/kC < 1, whereas only about half of MRNs have kV/kC > 1, but, for some, kV/kC >> 1.

