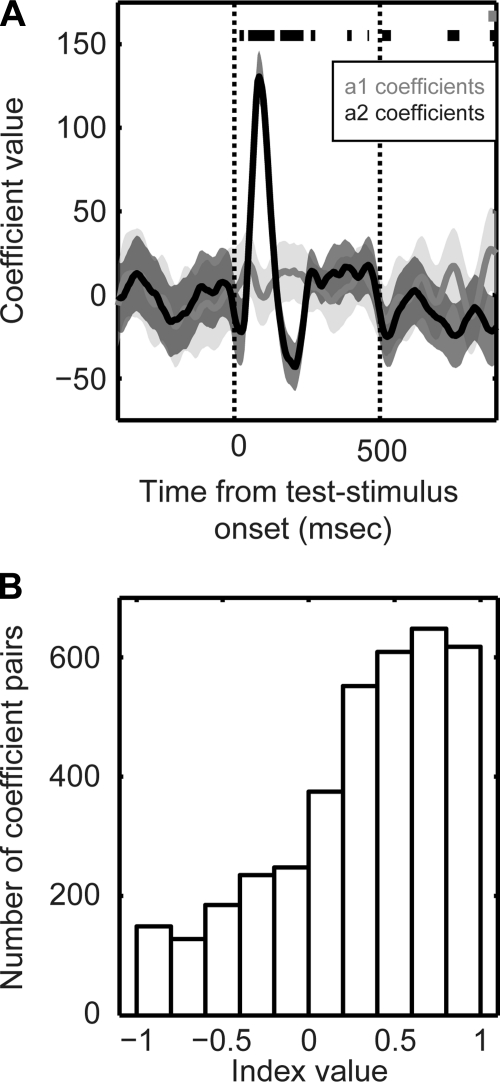
Fig. 5.
Dependence of STG activity on the reference and test stimuli. Firing rates of STG neurons were modeled as a linear function of both the reference stimulus and the test stimulus. The model took the following form: Firing_Rate = a1(t) * Morph_valueReference stimulus + a2(t) * Morph_valueTest stimulus + a3(t). The a1, a2, and a3 are regression coefficients, as a function of time. The a1 and a2 represent the effects of the reference and test stimulus, respectively, on a neuron's firing rate. A: a single neuron example of the linear relationship between test-stimulus activity and the reference and test stimulus. Solid lines indicate the mean value for each regression coefficient, and the shaded areas indicate the 95% confidence intervals of mean. Data in grey indicate the time-varying coefficient values for the reference stimulus (a1), whereas the data in black indicate the time-varying coefficient values for the test stimulus (a2). Thick bars at the top of the plot indicate those time points when a1 (gray bar) or a2 (black bars) were reliably different (P < 0.05) from 0. The 2 vertical lines indicate stimulus onset and offset, respectively. B: population analysis of the linear-regression model. Distribution of index values based on the difference between the absolute values of the a1 and a2 coefficients. If the index value was >0, it indicated that the absolute value of the a2 coefficient was greater than that of the a1 coefficient. If the index value was <0, it indicated that absolute value of the a1 coefficient was greater than that of the a2 coefficient.

