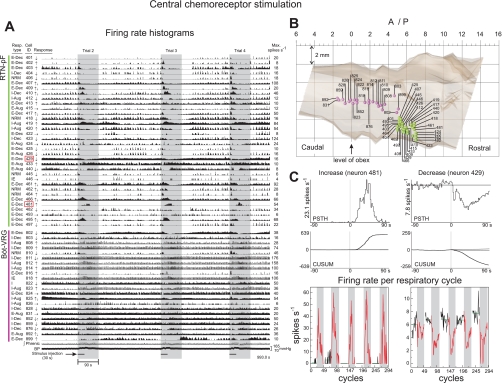
Fig. 3.
Central chemoreceptor stimulation. A: firing rate histograms for 56 of 75 simultaneously monitored RTN-pF and Böt-VRG neuron spike trains during sequential stimulation of central chemoreceptors. For each trace, the respiratory-modulated pattern, cell identification number, response to central chemoreceptor stimulus, and maximum firing rate are shown. Vertical gray panels delineate 3 of 5 central chemoreceptor stimulus evaluation periods: 30-s stimulus injection plus a 60-s poststimulus period. Response profiles of neurons outlined with red boxes are detailed in C. B: colored spheres (green: RTN-pF, pink: Böt-VRG) mark coordinates of recording sites for single neurons illustrated in A. C: peristimulus time histograms (PSTH) and corresponding cumulative sum histograms (CUSUM) depict the increase (left) and decrease (right) responses of neurons 481 and 429, respectively. The PSTH plots the average firing rate of the cell 90 s before and after stimulus onset (applied at time 0) over all 5 presented challenges. The CUSUM reflects the data trends depicted in the PSTH. The bottom graph is a display of the firing rate per respiratory cycle for five paired control (white panels) and stimulus periods (gray panels) used to calculate statistics. See methods.

