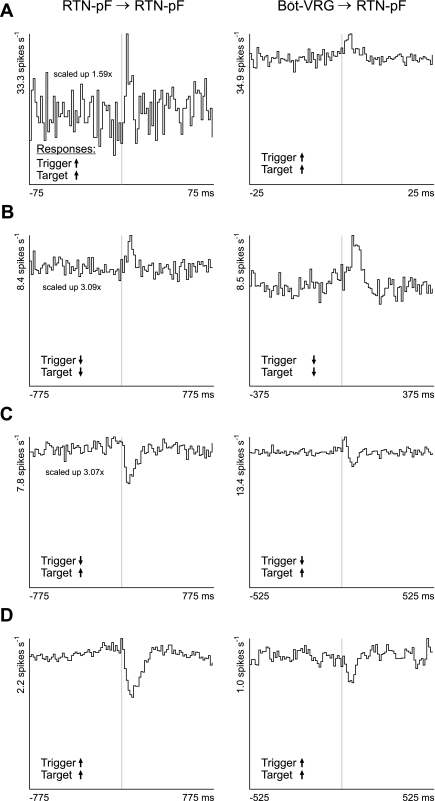
Fig. 7.
Correlation features among central chemoresponsive neurons provide evidence for functional connectivity proposed to influence responses of RTN-pF target neurons. Left: cross-correlation histograms calculated from pairs of chemoresponsive RTN-pF neurons. Right: CCHs from chemoresponsive neuron pairs consisting of a Böt-VRG trigger neuron and RTN-pF target neuron. Central chemoreceptor responses of trigger and target neurons are delineated with up (increase) and down (decrease) black arrows in the lower left corner of each CCH. A: trigger and target neurons both increase firing rate in response to central chemoreceptor perturbation. CCH A left: exhibits an offset peak, DI = 3.84, 1.5 ms binwidth, 1,687 trigger spikes, and 89,177 target spikes; CCH A right: offset peak, DI = 9.21, 0.5 ms binwidth, 72,867 trigger spikes, and 118,307 target spikes. B: trigger and target neurons both decrease firing rate. CCH B left: offset peak, DI = 3.49, 15.5 ms binwidth, 33,461 trigger spikes, and 53,671 target spikes; CCH B right: offset peak, DI = 6.82, 7.5 ms binwidth, 4,263 trigger spikes, and 33,461 target spikes. C: Trigger and target neurons whose firing rates decrease and increase, respectively, in response to stimulation. CCH C left: offset trough, DI = 7.63, 15.5 ms binwidth, 91,386 trigger spikes, and 97,841 target spikes; CCH C right: offset trough, DI = 7.89, 10.5 ms binwidth, 49,233 trigger spikes, and 119,144 target spikes. D: trigger and target neurons both respond to stimulation by increasing their firing rates. CCH D left: offset trough: DI = 11.71, 15.5 ms binwidth, 71,132 trigger spikes, and 28,640 target spikes. CCH D right: offset trough, DI = 5.98, 10.5 ms binwidth, 114,866 trigger spikes, and 12,201 target spikes.

