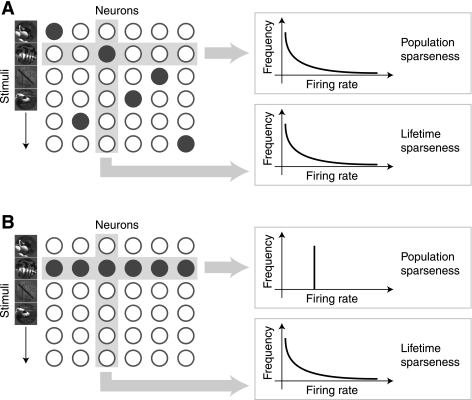
Fig. 6.
Relationship between lifetime and population sparseness. The response of a neural population can be described as a 2-dimensional matrix, and the sparseness of this matrix can be measured in 2 ways. Each column represents the responses of a single neuron to multiple stimuli. This is the lifetime response distribution of the neuron. Each row represents the responses of all neurons to a single stimulus. This is the population response distribution. We estimate lifetime sparseness by taking the mean sparseness of the lifetime response distributions, and population sparseness by taking the mean sparseness of the population response distributions. A: when the neural responses are independent and identically distributed (i.i.d.), lifetime and population sparseness are equivalent. B: when responses are not i.i.d., lifetime and population sparseness are not equivalent. For example, if the responses are perfectly correlated, then population sparseness will be extremely low, regardless of lifetime sparseness. Thus lifetime and population sparseness cannot generally be assumed to be equivalent.

