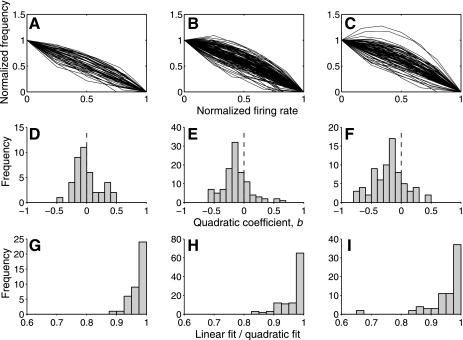
Fig. 9.
Shapes of typical lifetime response distributions of neurons in areas V1, V2, and V4. A–C: lifetime response distribution were measured for neurons in V1, V2, and V4 during a simple fixation task and normalized so that the x-axis covered the range (0, 1) and log transformed. The y-axis was normalized so that the value in the 0 bin was 1 and the value in the highest bin was 0. Under this transformation, a straight line corresponds to an exponential distribution, and deviations from straightness indicate deviation from the exponential. D–F: each log distribution was fit with a quadratic. The distribution of values of the resulting quadratic term are shown here. Negative values indicate positive curvature, and positive values indicate negative curvature. In V1, the mean value is 0, but in V2 and V4, there appears to be a bias toward positive curvature. G–I: to assess the importance of the observed deviations from the exponential, we calculated the ratio of variance accounted (r2) for a linear and quadratic model for each neuron. The linear model accounts for 90% as much variance as the quadratic in almost all neurons, indicating that the quadratic terms are relatively unimportant.

