Figure 1.
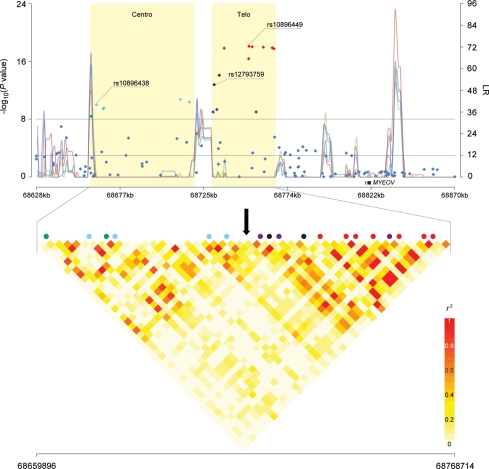
Association analysis result, recombination hotspots and LD of 11q13 region. The upper panel shows P-values for association testing from stages 1–3 combined CGEMS prostate cancer scan across a region of 11q13 bounded by rs930782 and rs4584599 (Chr11:68 628 370–68 870 174). Shaded regions ‘Centro’ and ‘Telo’ correspond to the centromeric region and the telomeric region, respectively. The line graph shows likelihood ratio statistics for recombination hotspot by SequenceLDhot software and five different colors represent 5 tests of 900 combined controls without resampling. The upper horizontal line indicates a genome-wide significance level (P-value of <10−8) and the lower horizontal line indicates a likelihood ratio statistic cutoff to predict the presence of a hotspot with a false-positive rate of 1 in 3700 independent tests (26). The lower panel shows an enlarged view of the region bounded by rs1123608 and rs4131929 (Chr11:68 659 896–68 768 714). The pair-wise r2 correlation coefficient for SNPs in the region was estimated using TagZilla and plotted using SnpPlotter (41). The 18 SNPs with genome-wide significance were color coded. Light-blue represents correlation bin1 SNPs (rs10896438, rs2924538, rs11228551 and rs11228553), purple represents bin2 SNPs (rs4255548, rs4495900 and rs7950547) and red represents bin3 SNPs (rs4620729, rs7931342, rs10896449, rs9787877, rs7939250, rs10896450 and rs11228583). Green and black represent singleton SNPs with no proxy (r2 > 0.8), but colored to show separation by a recombination hotspot (green, rs10896437 and rs2924540; black, rs12793759 and rs12281017). A black arrow indicates the recombination hotspot that separates the region into centromeric and telomeric regions.

