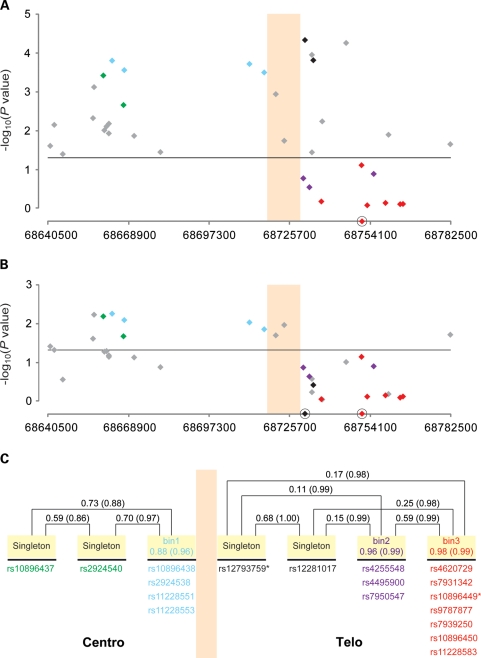
Figure 2.
Sequential multi-locus model of SNPs in the 11q13 region. The colored vertical boxed area represents the region of the observed recombination hotspot. Eighteen SNPs that showed genome-wide significance (P< 10−8) in the single-SNP analysis (Table 1) were color coded comparably with Figure 1. SNPs in gray were observed to be not genome-wide significant in the single-SNP model but of interest in the multi-locus modeling. (A) Shows the two SNP multi-locus analysis conditioned on rs10896449 (a red diamond on the x-axis). Twenty eight SNPs remained significant at an alpha of 0.05 (horizontal line). rs12793759 is the most significant SNP (per allele OR = 1.14, 95% CI: 1.07–1.21, P = 4.76 × 10⁻⁵, adjusted P = 0.004). (B) Shows the three-SNP multi-locus analysis conditioned on rs12793759 and rs10896449 (black diamond and red diamonds on x-axis, respectively). Thirteen SNPs showed significance at an alpha level of 0.05 (horizontal line) with rs10896438 being the most significant SNP (per allele OR = 1.07, 95% CI: 1.02–1.12, P = 5.92 × 10⁻³, adjusted P = 0.054). (C) Depicts the correlation patterns of the 18 genome-wide significant SNPs with color coding as per Figure 1. Correlation bins were defined with an r2 > 0.8 threshold and based on the analysis of all controls of European background in this study. Four SNPs that had no proxy with the threshold were denoted as ‘singleton'. The pair-wise (singleton versus singleton) or average (singleton versus bin, SNPs within a bin) correlation values are expressed by r2 (D′).

