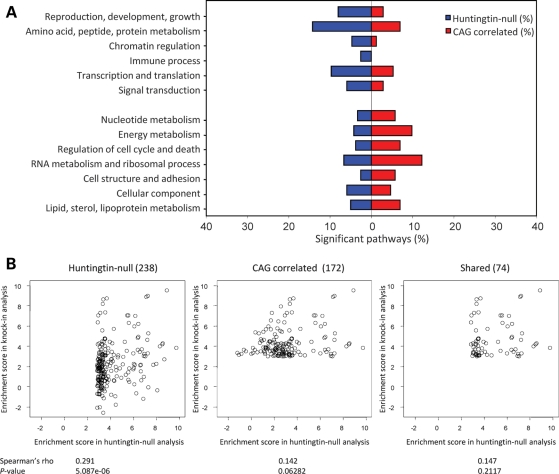
Figure 6.
CAG-correlated and huntingtin-null pathway categories. A summary of sigPathway analysis results, with significant pathways for each paradigm grouped by category is presented (A), with results of correlation analysis testing the relationship between huntingtin-null significant pathways (KO) and the CAG-correlated pathways (KI) (B–D). (A) Bar plot of the proportion (X-axis) of the 238 pathways significantly enriched in the huntingtin-null ES cell comparison (blue) and the 172 significantly CAG-correlated pathways across the knock-in ES cell data sets (red) within 13 shared categories (Y-axis). (B) Left scatter plot displays the relationship of the enrichment scores of 238 huntingtin-null significant pathways (X-axis; NTk values) with the enrichment score for these pathways in the continuous CAG ES cell knock-in pathways analysis (Y-axis; NTk values). The Spearman's rank correlation statistic (rho) and the significant P-value indicate that the huntingtin-null pathways capture to some extent the CAG-correlated pathway set. Middle scatter plot displays the relationship of the enrichment scores of the 172 continuous CAG-correlated pathways (X-axis) with the enrichment score for these pathways from the huntingtin-null analysis (Y-axis). The Spearman's rank correlation statistic (rho) and the non-significant P-value indicate that the pathways significantly altered with the CAG size are not altered by the absence of huntingtin. The right scatter plot shows the relationship between the enrichment scores of 74 pathways significant in both the huntingtin-null ES cell analysis (X-axis) and the CAG continuous ES cell data analysis (Y-axis). The Spearman's rank correlation statistic (rho) and the non-significant P-value indicate that the enrichment score in one analysis does not predict the enrichment score in the other paradigm, indicating that these pathways are not consistently altered in the different paradigms.

