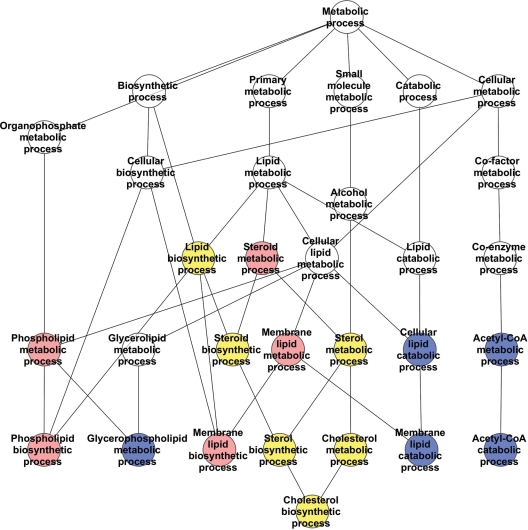
Figure 8.
Lipid, sterol and lipoprotein metabolism category pathways network. A schematic demonstrating the hierarchy of relationships between the processes/pathways significantly correlated with the CAG repeat length (red), significantly altered in the absence of huntingtin (blue) or significantly altered in both full-length huntingtin genetic paradigms (yellow). The catalytic activity ‘phospholipase A2’, which is significantly changed only in the absence of huntingtin, is not depicted on the pathway annotation diagram. Only directly related pathways are illustrated. The KEGG/GO annotations for the pathways are provided in Supplementary Material, Figure S4.

