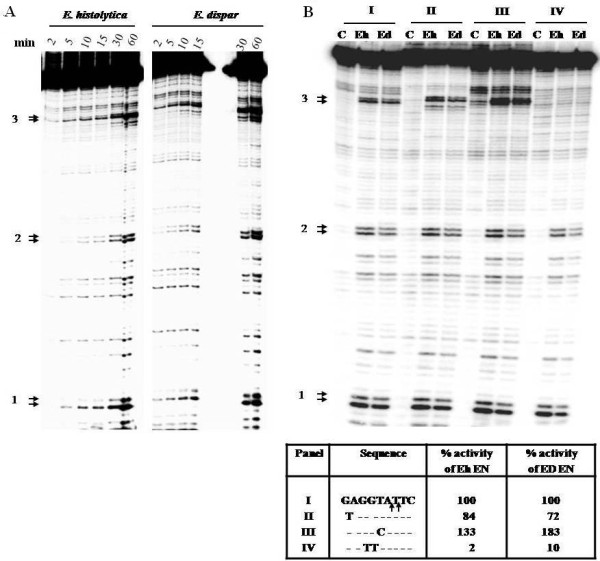
Figure 7.

Comparative nicking profile of Eh EN and Ed EN with 176 bp substrate containing an unoccupied insertion site of EhSINE1. (A) End labeled 176 bp substrate was incubated with each enzyme for the indicated time. The reaction products were separated through 8% polycarylamide gel containing 7 M urea as mentioned in Materials and Methods. The three major nicking sites seen with Eh EN are marked. (B) Nicking activity of Eh EN and Ed EN on substrates mutated at site #3 (sequences flanking the nicking sites are shown in the box). Substrate I is wild type and mutations in substrates II-IV are indicated. Arrows in sequence I indicate nicking sites. Lane C in each panel indicates 0 min. incubation. Each substrate was incubated with enzyme for 60 min. The ratio of band intensity of sie#3/site#2 for each mutated substrate was calculated and compared with control substrate to obtain the percentage activity.
