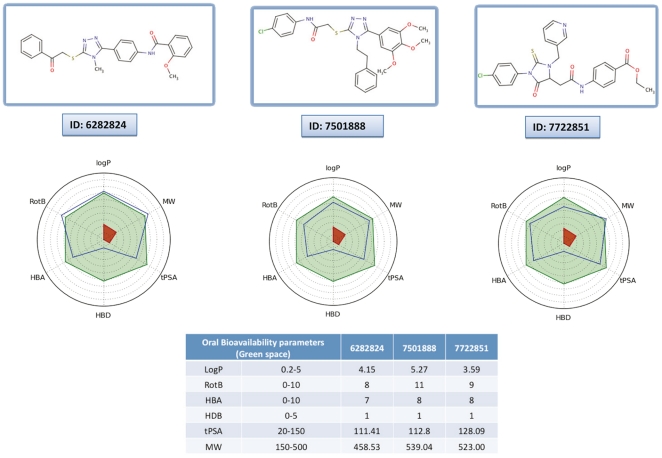
Figure 6. Physico-chemical profile of compounds 6282824, 7501888, 7722851.
A radar plot representing the computed oral bioavailability profile (compound blue line should fall within the optimal green area, white and red ones being extreme zones generally indicating low oral bioavailability). This analysis was carried out on all molecules but we present the data only for three compounds. The computations involved: logP, molecular weight (MW), topological polar surface area (tPSA), rotatable bond (RotB), H-bonds acceptors and donors (HBA, HBD).

