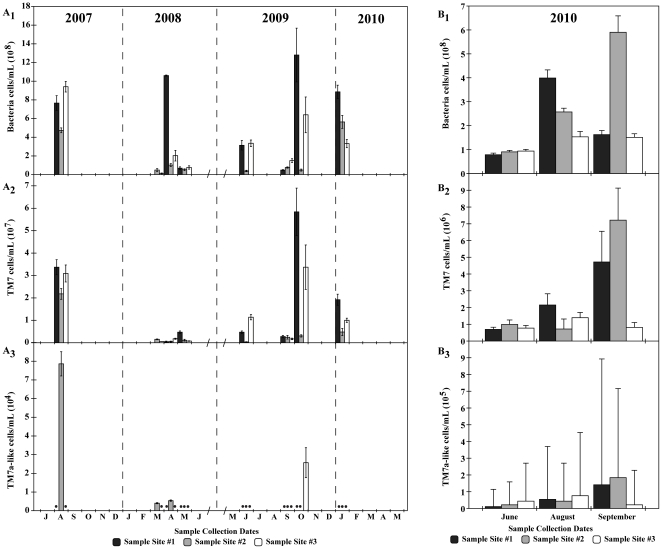
Figure 2. Quantification of Bacteria, TM7, and TM7a-like phylotypes by (A) qPCR and (B) FISH.
Average number of (A1 and B1) Bacteria cells mL−1, (A2 and B2) Candidate Division TM7 cells mL−1, and (A3 and B3) TM7a-like cells mL−1. Closed circles indicate undetermined quantification values. Error bars represent standard error of the mean.

