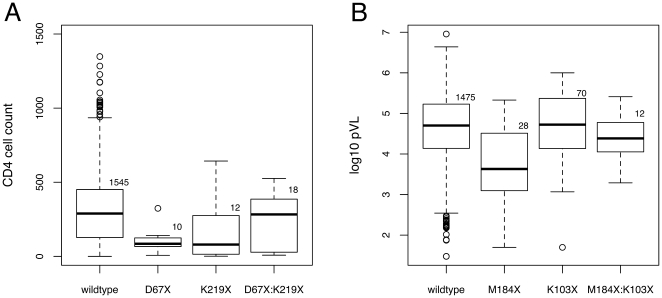
Figure 5. Box-and-whisker plots illustrating (A) the effects of SDRMs at positions D67 and K219 on CD4 cell count and (B) the effects of SDRMs at positions M184 and K103 on plasma viral load (pVL).
‘Wildtype’ denotes sequences lacking SDRMs at both positions, irrespective of whether any other SDRMs were present at other positions in protease or RT. Solid lines indicate the group median and open circles denote outliers that fall outside the region defined by 1.5 times the interquartile range. Plot (A) was rescaled with respect to untransformed CD4 counts to emphasize differences among groups, trimming 4 outliers from the ‘wildtype’ group (1602, 1626, 1838, and 2073 cells/mL) from the plot region. Sample sizes per group are annotated on each plot.

