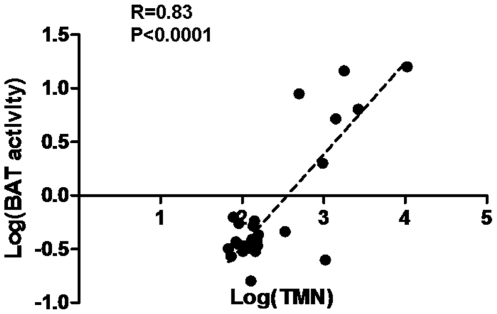
Figure 2. Activities of brown adipose tissue in relation to total metanephrine levels.
For all subjects, the activities of brown-adipose-tissue (BAT) were plotted against their total metanephrine (TMN) values following Log transformation. Statistical analysis was performed using Pearson correlation test: R = 0.83, p<0.0001.

