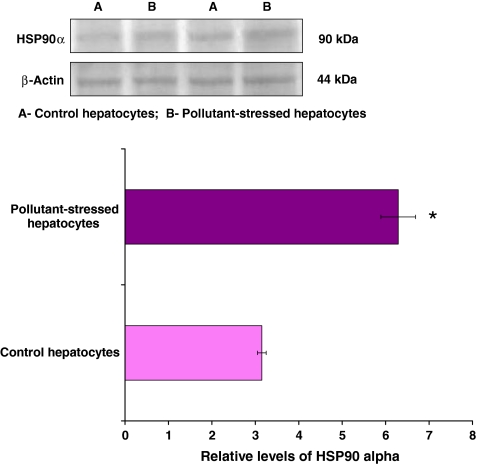
Fig. 1.
Expression pattern of HSP90α in hepatocytes of M. cephalus inhabiting the control and pollutant-stressed estuaries. Representative immunoblot is shown. β-Actin has been used as the loading control. A and B represent control and pollutant-stressed hepatocytes, respectively, and the bar graph shows the densitometric evaluation. Values are expressed as means ± SE (n = 16 fish per estuary). *p < 0.05, significant when compared with control hepatocytes

