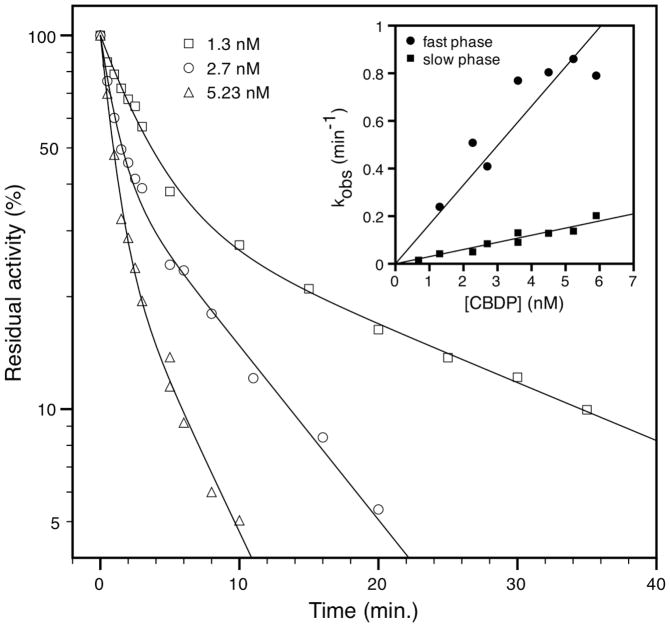
Fig. 1.
Time course of inhibition of hBChE by different concentrations of CBDP in 50 mM sodium phosphate pH 8.0, containing 10% MeOH at 25°C. The solid curve represents the non-linear regression fit using equation (2). Insert: secondary plot used for determination of the bimolecular rate constants of inhibition (ki and k’i) for fast and slow phase, according to equation (4).

