
Figure 5. Renal morphology is altered in kidney-specific MnSOD KO mice.
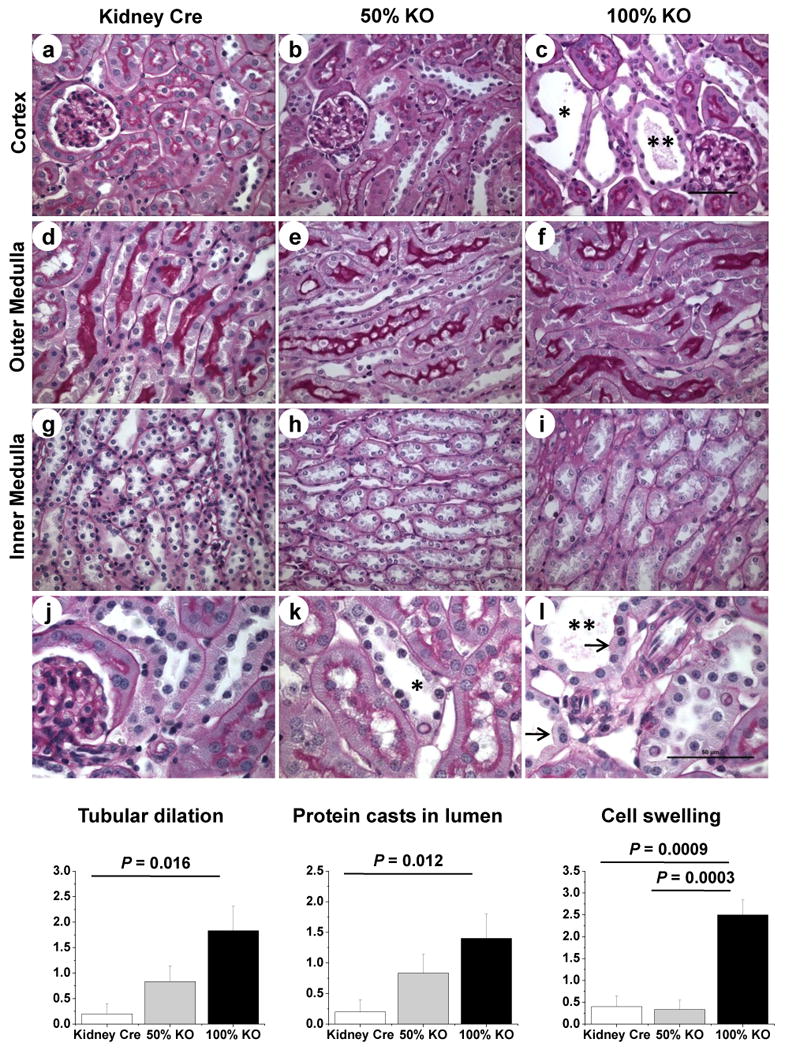
Representative 400× micrographs of PAS staining in renal cortex (a-c); outer medulla (d-f) and inner medulla (g-i) of Kidney Cre, 50% and 100% KO mice. Representative cortical sections (400×) were enlarged in panels j-l to show the dilation of distal tubules (asterisk), protein casts formation (double asterisks), and epithelial cell swelling (arrow) in tubules from MnSOD KO mice. Representative bars indicate 50 μm for 400 × images. The graphs show the pathological scoring for tubular dilation, protein casts in lumen, and cell swelling of Kidney Cre, 50% KO and 100% KO mice. Error bar indicates Mean ± SEM (n = 5 - 6).