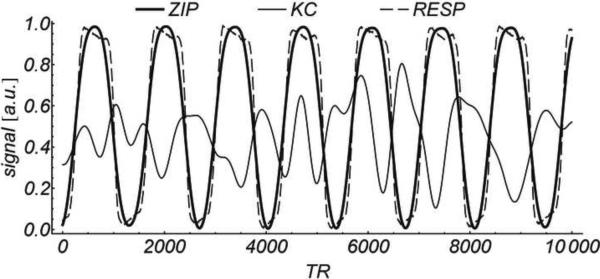
Figure 3.
Comparison of motion gating signals obtained in the motion phantom experiment Squared linear correlation with the simultaneously acquired respiratory bellows signal (RESP) was r2 = 0.20 for KC vs. r2 = 0.95 for ZIP. For illustrative purposes, all signals are scaled and shifted to the [0, 1] range, and only a fraction of the total waveform (10,000 TRs or about 42 sec.) is shown.

