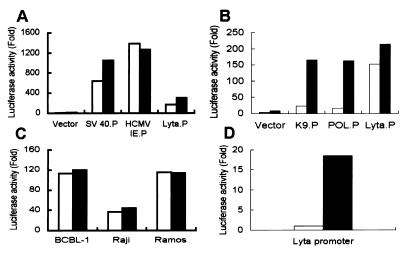
Figure 5.
Luciferase reporter assay of the Lyta promoter compared with other promoters and in different cell lines. Open bars in A, B, and C represent untreated TPA. Solid bars in A, B, and C represent TPA treated immediately after transfection. Cells were collected 48 h after transfection; luciferase activity values were normalized to a cotransfected internal control plasmid (pCMV-β-gal) and shown as folded, as compared with a promoterless vector (pGL3), which is defined as 1. (A) Compared with other virus IE promoters (human cytomegalovirus and simian virus 40) in 293T cells. (B) Compared with other gene promoters of KSHV [K9.P (ORF K9 promoter), POL.P (DNA polymerase promoter)] in 293T cells. (C) Lyta promoter activity in different cell lines with or without TPA treatment. (D) Lyta promoter activity in 293T cells cotransfected with pcDNA3.1 vector (open bar) or pcDNA3.1-ORF 50 cDNA clone (solid bar).

