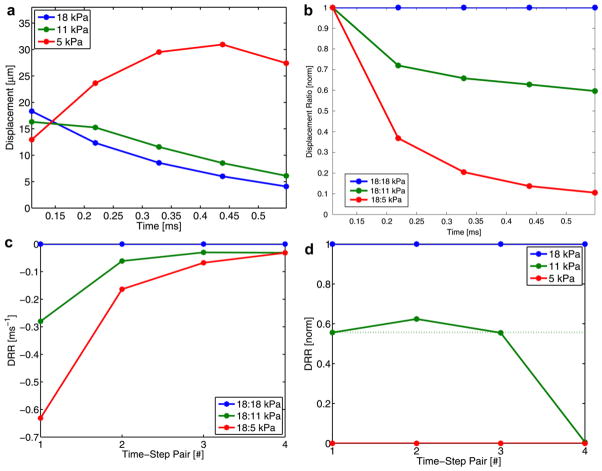
Fig. 2.
Graphic depiction of the DRR method. In the first plot (a), on-axis displacement resulting from an ARFI excitation in three phantoms (5, 11 and 18 kPa) is shown; time is given in milliseconds after the initiation of the ARFI excitation. In the second plot (b), traces of normalized (to the peak value for each trace) displacement ratios (with the 18-kPa displacement trace as the numerator) are presented. In the third plot (c), traces of finite differences between successive time points (i.e., time-step pairs) is depicted. In the final plot (d), the range of finite difference values for each time-step pair is normalized; the dotted line indicates the expected value.

