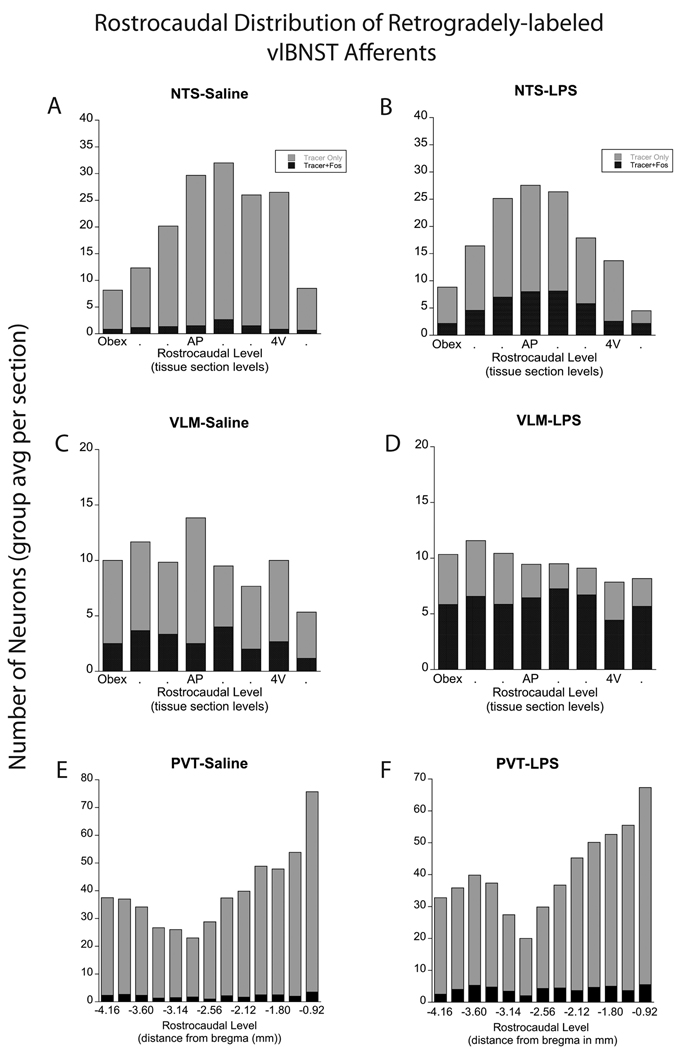
Figure 2. Rostrocaudal distribution of retrogradely-labeled neurons in the NTS, VLM, and PVT.
Rostrocaudal distribution of retrograde labeling in the NTS, VLM, and PVT in rats after control saline (left panels; n=6) or LPS treatment (right panels; n=8). The number of single- and double-labeled NTS neurons (A, B) was greatest at the rostrocaudal level of the mid area postrema (AP) and just rostral to it. Within the VLM (C, D), single- and double-labeled neurons were distributed more evenly across rostrocaudal levels. The proportion of tracer-labeled NTS and VLM neurons that expressed Fos was significantly increased in rats after LPS treatment (see Fig. 5 and Table 1). Larger numbers of tracer-labeled neurons were present within the rostral half of the PVT (rPVT) compared to the caudal half (cPVT; E, F). LPS treatment produced a small yet significant increase in the number and proportion of double-labeled (activated) neurons in the rPVT, but not in the cPVT, compared to saline control treatment (see Fig. 5 and Table 1). 4V=fourth ventricle.

