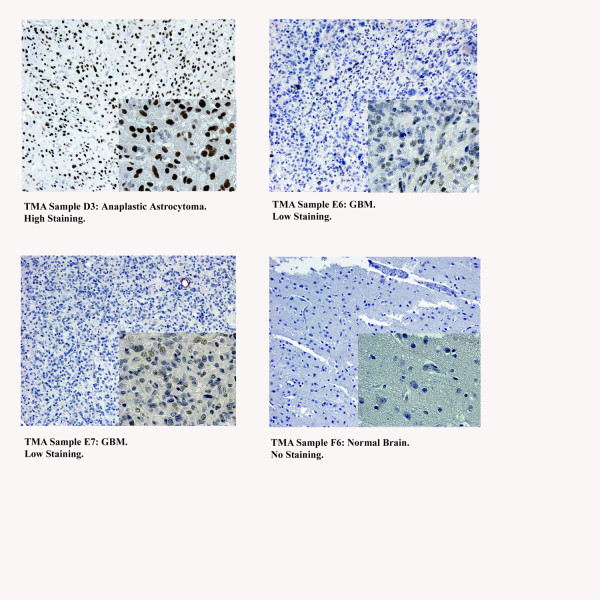
Figure 2.
Tissue Microarray (TMA), representative images of staining categories. All images were probed for total STAT6 protein by IHC. Upper left: tissue sample of a Grade III (anaplastic) astrocytoma showing high staining intensity in the nuclei of the majority of cells. Upper right: GBM tissue sample demonstrating an example of low staining: some nuclei exhibit dark staining, but less than half the cells are positive for STAT6. Lower left: GBM sample showing weak staining intensity in the majority of nuclei. This was also called low staining. Lower right: Tissue sample of normal brain, showing no STAT6 staining in the nucleus or elsewhere.

