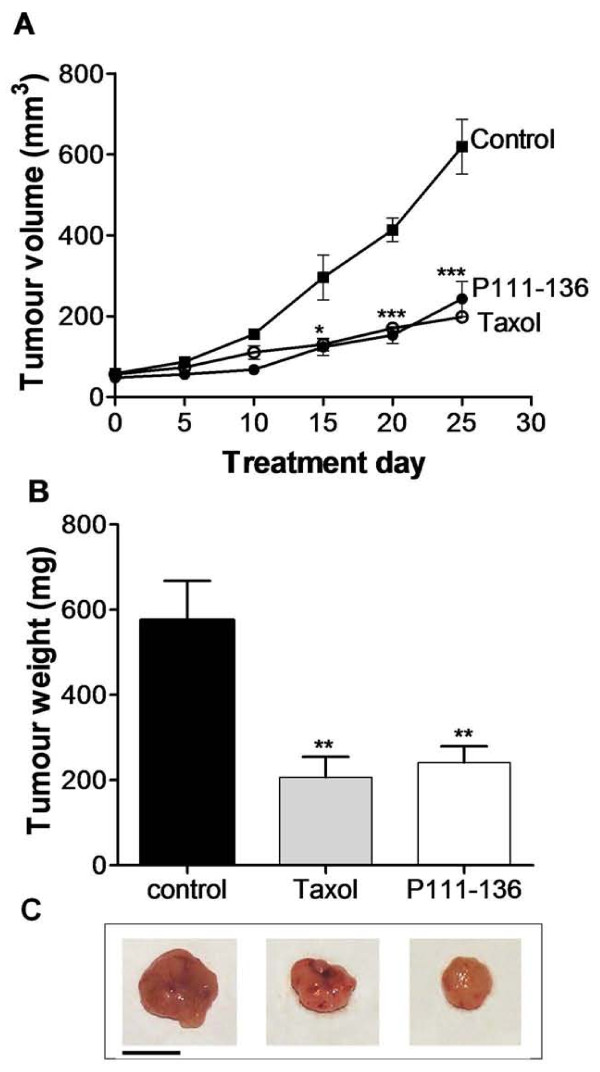
Figure 2.
Inhibition of tumour growth by peptide P111-136. (A), Tumour-growth curves. PC-3 carcinoma cells (2 × 10⁶) were injected subcutaneously into the right flanks of female nude mice. When tumour size was about 60 mm3, mice received peritumoral injections of P111-136 (5 mg/kg/day) (black circle), Taxol® (10 mg/kg twice a week) (white circle), or PBS used as vehicle. (black square) for 25 days. Tumours were measured twice a week. (B), The mice were sacrificed 25 days after the cell injection; the tumours were excised and weighed. (C), A representative excised tumour of each group was represented below. Scale bar, 1 cm. The data are mean tumour volume or weight +/- SD obtained from 5 mice in each group. *p < 0.05, **p < 0.01, and ***p < 0.001 versus control (untreated tumours).

