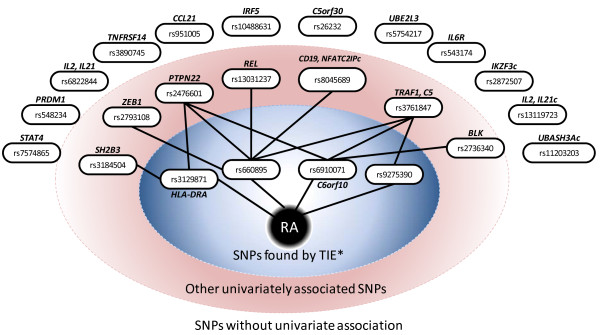
Figure 4.
Previously known SNP associations become statistically independent of the phenotype conditioned on 4 SNPs discovered by TIE*. The phenotypic response variable is shown with black circle in the middle ("RA") and SNPs are shown with white ovals. SNPs that have a univariate association with the phenotype (according to G2 test at significance level α = 5%) have a path to "RA". SNPs that become statistically independent of the phenotype given a subset of 4 SNPs found by TIE* (so-called "conditioning set") are connected with "RA" by indirect paths that go through SNPs in the corresponding conditioning set.

