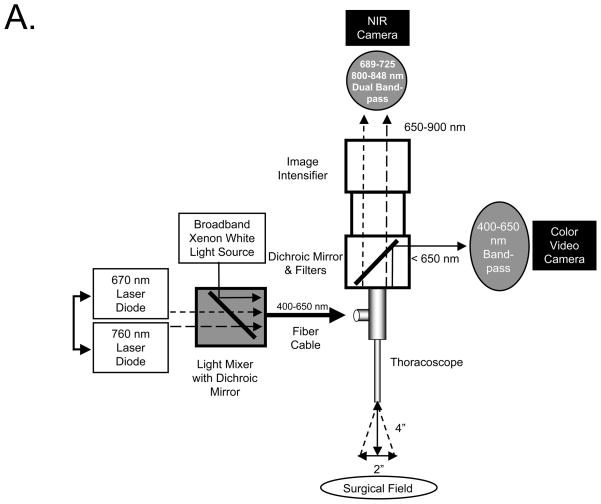
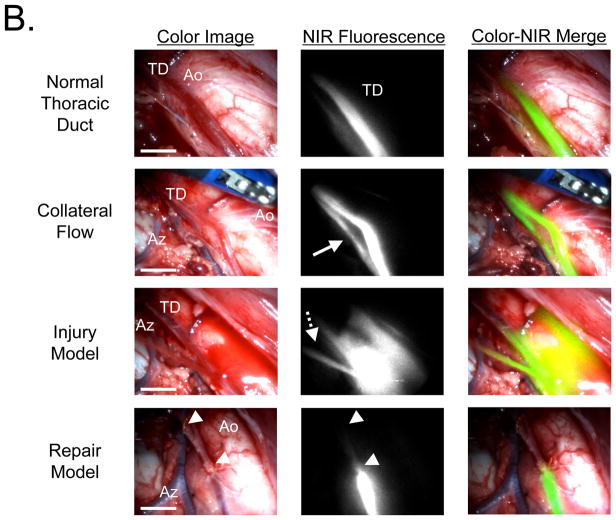
Figure 4. NIR Fluorescence Imaging of the Thoracic Duct using m-FLARE and VATS.
A. Light paths and system components of the m-FLARE imaging system for VATS.
B. VATS-based m-FLARE imaging of the thoracic duct. Shown are representative images 30 min after injection of 36 μg/kg ICG into the lower leg of pigs (n = 2). Conditions included normal flow (top row), collateral flow (second row; solid arrow), an injury model (third row; dotted arrow), and image-guided repair of the thoracic duct (bottom row; arrowheads). Shown are color video (left), NIR fluorescence (middle), and a pseudo-colored (lime green) merge of the two (right). Ao: aorta, TD: thoracic duct, and Az: azygos vein. Scale bar = 1 cm.


