Figure 12.
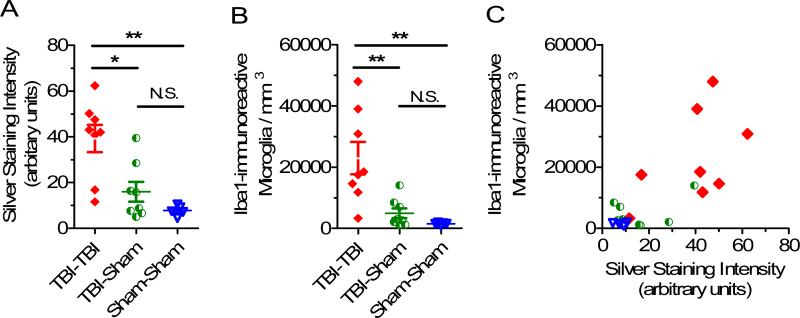
Relationship between silver staining intensity and Iba1 immunoreactive, activated microglial cell counts. (A) Silver staining intensity in ipsilateral cortex 7 days after 2 closed-skull impacts (TBI-TBI), traumatic brain injury (TBI) -Sham or Sham-Sham procedures. (*p = 0.007, **p = 0.0019, unpaired 2-sided t-tests) (B) Iba1 immunoreactive, activated microglial cell counts in the same ipsilateral cortical region from the same mice (*p = 0.006, **p = 0.0013, unpaired 2-sided t-tests). (C) Quantitative correlation between silver staining intensity and Iba1-immunoreactive, activated microglial cell counts. Scatter plot of silver staining intensity vs. Iba1-immunoreactive activated microglia cell counts in ipsilateral cortex at 7 days. Each symbol represents one mouse. Spearman r = 0.64, p = 0.0018.

