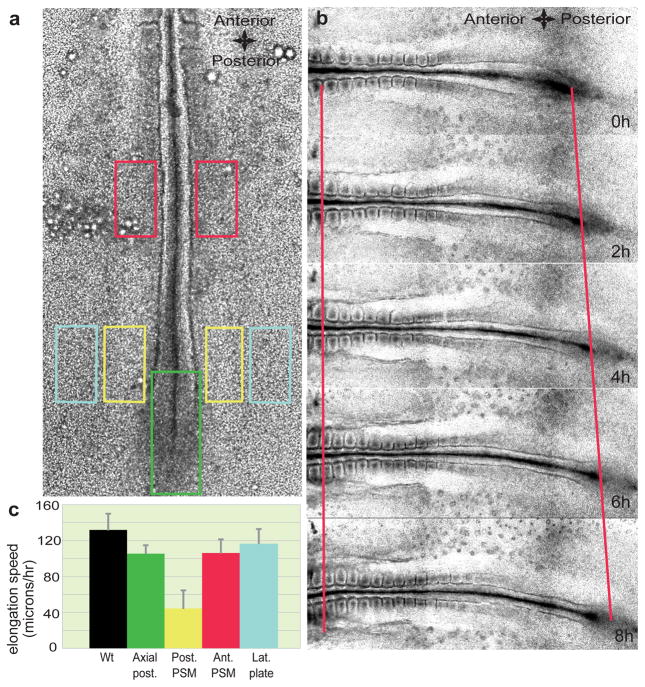
Figure 1. Role of caudal PSM in embryo elongation.
a, Position of the ablations of the posterior PSM (yellow rectangles), lateral plate mesoderm (light blue rectangles), caudal axial tissue (green rectangle) and anterior PSM (red rectangles) in a stage HH11 embryo. b, Snapshot of different time points (during an 8-hour time period) showing elongation (red lines) of a wild type (Wt) embryo starting at stage HH11. The left red line denotes the level of somite 3, while the right red line denotes the level of Hensen’s node. c, Elongation speed measurements. Error bars indicate the standard deviations. The black histogram corresponds to the elongation rate of non-ablated Wt embryos.

