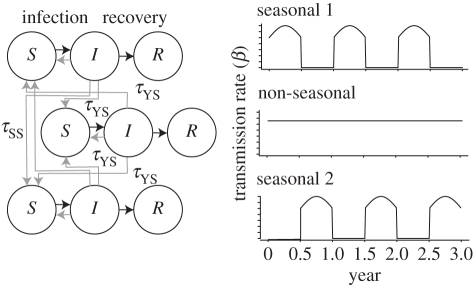
Figure 1.
Schematic model diagram. The global population is divided into three regions. Transmission is seasonal in two regions, year round in the third. Each population consists of susceptible (S), infected (I) and recovered (R) individuals. Black lines indicate the flow between these states. Grey lines indicate transmission interaction.

