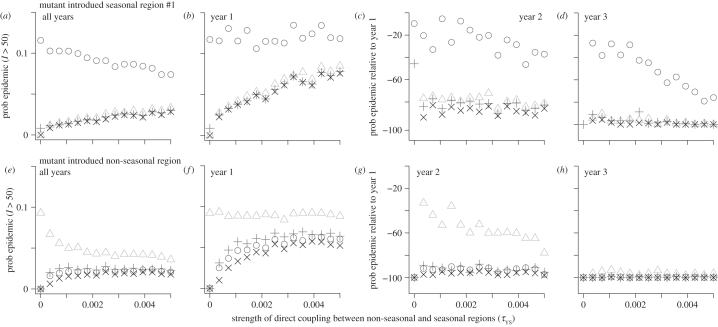
Figure 3.
Probabilities, as a function of coupling between seasonal and non-seasonal regions, that a significant outbreak results from the introduction of one individual infected with a mutant strain into a population experiencing a wild-type epidemic. (a–d) Mutant introduced in seasonal region 1. (e–h) Mutant introduced in non-seasonal region. (a,e) Total probability over all introduction times in the first four years of the wild-type epidemic. (b,f) Probability if the mutant strain is introduced in year 1. (c,d,g,h) Probability if the mutant is introduced in year 2 or 3, expressed as the percentage change relative to year 1. Circles, probability of mutant epidemic in seasonal region 1; triangles, non-seasonal region; plus symbols, seasonal region 2; crosses, all regions. Each point is the result of 10 000 independent trials. Initially, all hosts susceptible except for 10 individuals with wild-type infections in seasonal region 1. Parameter values as in electronic supplementary material, table S1, except σ = 0.1. No mutation.

