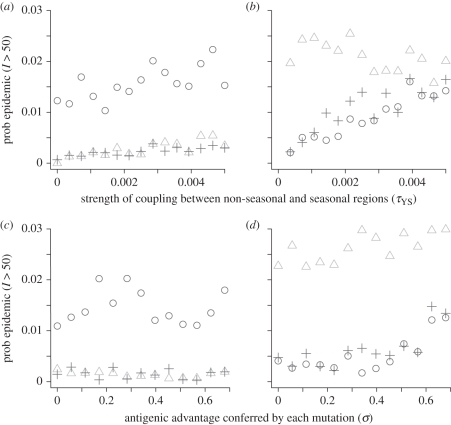
Figure 4.
Probabilities that mutant strains emerging spontaneously from existing strains cause epidemics: (a,b) depending on the strength of coupling between seasonal and non-seasonal regions when each difference between antigenic genotype sections translates into a re-infection probability of σ = 0.1; (c,d) depending on the re-infection probability (σ) conferred by each difference between antigenic genotype sections when the coupling between seasonal and non-seasonal regions is τYS = 0.0005. (a,c) Mutant strains emerging in seasonal region 1. (b,d) Mutant strains emerging in the non-seasonal region. All panels show the probability that the mutant causes at least 50 simultaneous infections in seasonal region 1 (circles), non-seasonal region (triangles) and seasonal region 2 (plus symbols). Each point is the result of 100 independent trials. Initially, all hosts susceptible except for 10 individuals with wild-type infections in seasonal region 1. Parameter values as in electronic supplementary material, table S1.

